Delaware vs Immigrants from Yemen 3 or more Vehicles in Household
COMPARE
Delaware
Immigrants from Yemen
3 or more Vehicles in Household
3 or more Vehicles in Household Comparison
Delaware
Immigrants from Yemen
21.5%
3 OR MORE VEHICLES IN HOUSEHOLD
99.6/ 100
METRIC RATING
86th/ 347
METRIC RANK
14.2%
3 OR MORE VEHICLES IN HOUSEHOLD
0.0/ 100
METRIC RATING
324th/ 347
METRIC RANK
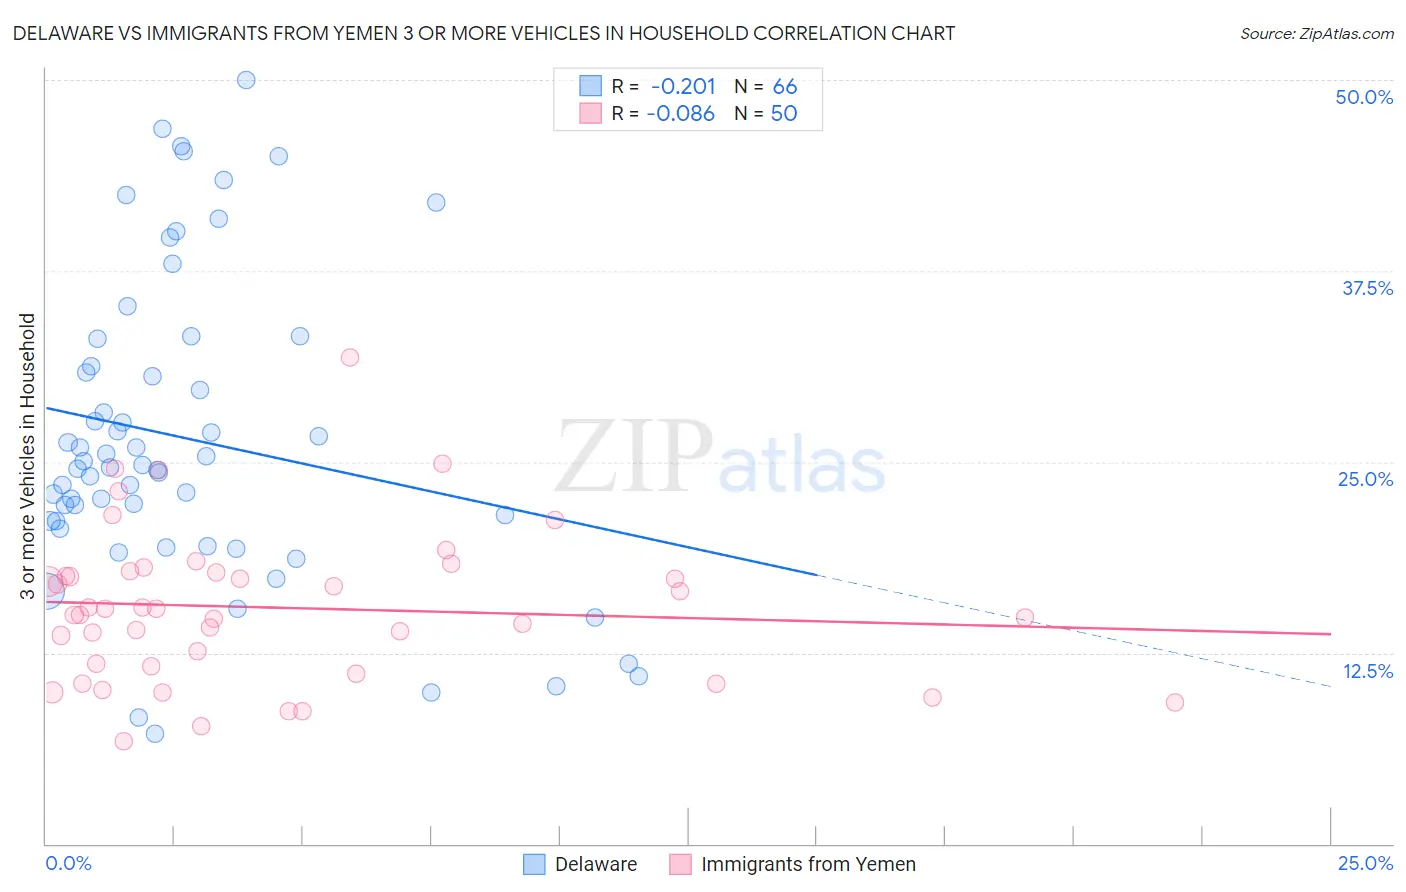
Delaware vs Immigrants from Yemen 3 or more Vehicles in Household Correlation Chart
The statistical analysis conducted on geographies consisting of 96,224,171 people shows a weak negative correlation between the proportion of Delaware and percentage of households with 3 or more vehicles available in the United States with a correlation coefficient (R) of -0.201 and weighted average of 21.5%. Similarly, the statistical analysis conducted on geographies consisting of 82,431,124 people shows a slight negative correlation between the proportion of Immigrants from Yemen and percentage of households with 3 or more vehicles available in the United States with a correlation coefficient (R) of -0.086 and weighted average of 14.2%, a difference of 50.9%.
3 or more Vehicles in Household Correlation Summary
| Measurement | Delaware | Immigrants from Yemen |
| Minimum | 7.2% | 6.7% |
| Maximum | 50.0% | 31.8% |
| Range | 42.8% | 25.1% |
| Mean | 26.5% | 15.5% |
| Median | 24.7% | 15.2% |
| Interquartile 25% (IQ1) | 21.1% | 11.6% |
| Interquartile 75% (IQ3) | 31.3% | 17.8% |
| Interquartile Range (IQR) | 10.1% | 6.1% |
| Standard Deviation (Sample) | 10.0% | 5.0% |
| Standard Deviation (Population) | 9.9% | 5.0% |
Similar Demographics by 3 or more Vehicles in Household
Demographics Similar to Delaware by 3 or more Vehicles in Household
In terms of 3 or more vehicles in household, the demographic groups most similar to Delaware are Laotian (21.5%, a difference of 0.080%), Icelander (21.5%, a difference of 0.090%), Immigrants from the Azores (21.5%, a difference of 0.12%), Chippewa (21.5%, a difference of 0.14%), and Immigrants from El Salvador (21.5%, a difference of 0.17%).
| Demographics | Rating | Rank | 3 or more Vehicles in Household |
| Assyrians/Chaldeans/Syriacs | 99.8 /100 | #79 | Exceptional 21.7% |
| Afghans | 99.7 /100 | #80 | Exceptional 21.7% |
| Celtics | 99.7 /100 | #81 | Exceptional 21.7% |
| Immigrants | El Salvador | 99.6 /100 | #82 | Exceptional 21.5% |
| Chippewa | 99.6 /100 | #83 | Exceptional 21.5% |
| Icelanders | 99.6 /100 | #84 | Exceptional 21.5% |
| Laotians | 99.6 /100 | #85 | Exceptional 21.5% |
| Delaware | 99.6 /100 | #86 | Exceptional 21.5% |
| Immigrants | Azores | 99.5 /100 | #87 | Exceptional 21.5% |
| French | 99.4 /100 | #88 | Exceptional 21.4% |
| Marshallese | 99.2 /100 | #89 | Exceptional 21.3% |
| Immigrants | Afghanistan | 99.1 /100 | #90 | Exceptional 21.2% |
| Belgians | 98.9 /100 | #91 | Exceptional 21.2% |
| Apache | 98.9 /100 | #92 | Exceptional 21.2% |
| Immigrants | Indonesia | 98.8 /100 | #93 | Exceptional 21.1% |
Demographics Similar to Immigrants from Yemen by 3 or more Vehicles in Household
In terms of 3 or more vehicles in household, the demographic groups most similar to Immigrants from Yemen are Senegalese (14.2%, a difference of 0.080%), Soviet Union (14.2%, a difference of 0.41%), Ecuadorian (14.1%, a difference of 1.3%), Immigrants from Albania (14.0%, a difference of 2.0%), and Immigrants from Caribbean (14.6%, a difference of 2.3%).
| Demographics | Rating | Rank | 3 or more Vehicles in Household |
| Jamaicans | 0.0 /100 | #317 | Tragic 15.2% |
| Immigrants | Haiti | 0.0 /100 | #318 | Tragic 15.2% |
| Cape Verdeans | 0.0 /100 | #319 | Tragic 15.0% |
| Yup'ik | 0.0 /100 | #320 | Tragic 14.8% |
| Immigrants | Jamaica | 0.0 /100 | #321 | Tragic 14.7% |
| Immigrants | West Indies | 0.0 /100 | #322 | Tragic 14.6% |
| Immigrants | Caribbean | 0.0 /100 | #323 | Tragic 14.6% |
| Immigrants | Yemen | 0.0 /100 | #324 | Tragic 14.2% |
| Senegalese | 0.0 /100 | #325 | Tragic 14.2% |
| Soviet Union | 0.0 /100 | #326 | Tragic 14.2% |
| Ecuadorians | 0.0 /100 | #327 | Tragic 14.1% |
| Immigrants | Albania | 0.0 /100 | #328 | Tragic 14.0% |
| Immigrants | Senegal | 0.0 /100 | #329 | Tragic 13.8% |
| West Indians | 0.0 /100 | #330 | Tragic 13.7% |
| Immigrants | Dominica | 0.0 /100 | #331 | Tragic 13.7% |