Croatian vs Immigrants from Yemen 3 or more Vehicles in Household
COMPARE
Croatian
Immigrants from Yemen
3 or more Vehicles in Household
3 or more Vehicles in Household Comparison
Croatians
Immigrants from Yemen
20.6%
3 OR MORE VEHICLES IN HOUSEHOLD
94.9/ 100
METRIC RATING
117th/ 347
METRIC RANK
14.2%
3 OR MORE VEHICLES IN HOUSEHOLD
0.0/ 100
METRIC RATING
324th/ 347
METRIC RANK
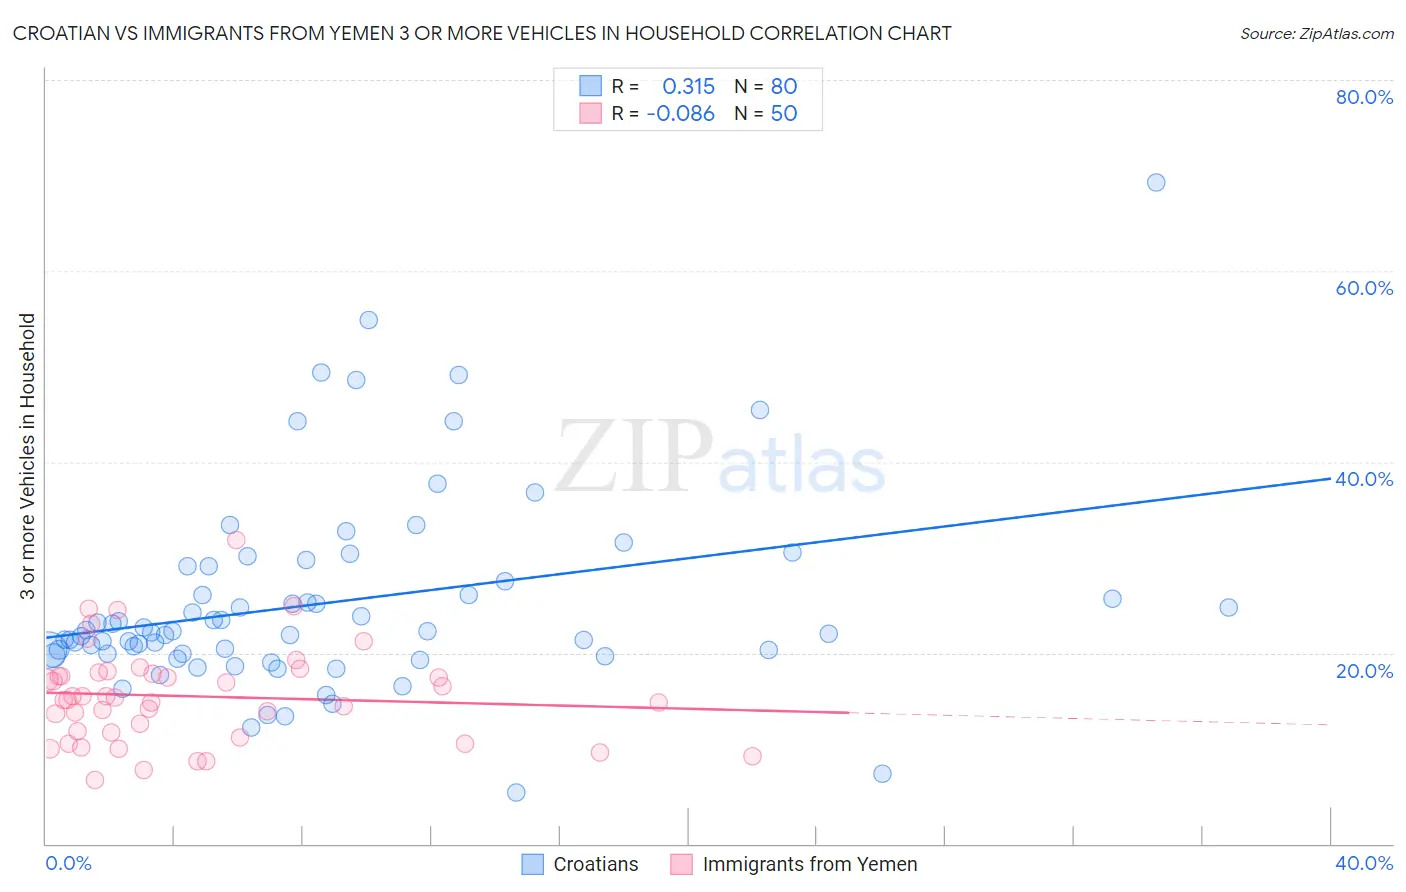
Croatian vs Immigrants from Yemen 3 or more Vehicles in Household Correlation Chart
The statistical analysis conducted on geographies consisting of 375,444,957 people shows a mild positive correlation between the proportion of Croatians and percentage of households with 3 or more vehicles available in the United States with a correlation coefficient (R) of 0.315 and weighted average of 20.6%. Similarly, the statistical analysis conducted on geographies consisting of 82,431,124 people shows a slight negative correlation between the proportion of Immigrants from Yemen and percentage of households with 3 or more vehicles available in the United States with a correlation coefficient (R) of -0.086 and weighted average of 14.2%, a difference of 44.5%.
3 or more Vehicles in Household Correlation Summary
| Measurement | Croatian | Immigrants from Yemen |
| Minimum | 5.4% | 6.7% |
| Maximum | 69.3% | 31.8% |
| Range | 63.8% | 25.1% |
| Mean | 25.2% | 15.5% |
| Median | 22.2% | 15.2% |
| Interquartile 25% (IQ1) | 19.9% | 11.6% |
| Interquartile 75% (IQ3) | 28.3% | 17.8% |
| Interquartile Range (IQR) | 8.4% | 6.1% |
| Standard Deviation (Sample) | 10.5% | 5.0% |
| Standard Deviation (Population) | 10.4% | 5.0% |
Similar Demographics by 3 or more Vehicles in Household
Demographics Similar to Croatians by 3 or more Vehicles in Household
In terms of 3 or more vehicles in household, the demographic groups most similar to Croatians are Italian (20.6%, a difference of 0.020%), French Canadian (20.6%, a difference of 0.050%), Costa Rican (20.6%, a difference of 0.11%), Immigrants from Latin America (20.5%, a difference of 0.15%), and Maltese (20.5%, a difference of 0.35%).
| Demographics | Rating | Rank | 3 or more Vehicles in Household |
| Asians | 96.8 /100 | #110 | Exceptional 20.8% |
| Immigrants | Micronesia | 96.7 /100 | #111 | Exceptional 20.7% |
| Nicaraguans | 96.2 /100 | #112 | Exceptional 20.7% |
| Immigrants | England | 96.2 /100 | #113 | Exceptional 20.7% |
| Burmese | 95.8 /100 | #114 | Exceptional 20.6% |
| French Canadians | 95.0 /100 | #115 | Exceptional 20.6% |
| Italians | 94.9 /100 | #116 | Exceptional 20.6% |
| Croatians | 94.9 /100 | #117 | Exceptional 20.6% |
| Costa Ricans | 94.6 /100 | #118 | Exceptional 20.6% |
| Immigrants | Latin America | 94.5 /100 | #119 | Exceptional 20.5% |
| Maltese | 93.9 /100 | #120 | Exceptional 20.5% |
| Immigrants | Thailand | 93.8 /100 | #121 | Exceptional 20.5% |
| German Russians | 93.7 /100 | #122 | Exceptional 20.5% |
| Immigrants | Korea | 93.7 /100 | #123 | Exceptional 20.5% |
| Central Americans | 93.1 /100 | #124 | Exceptional 20.5% |
Demographics Similar to Immigrants from Yemen by 3 or more Vehicles in Household
In terms of 3 or more vehicles in household, the demographic groups most similar to Immigrants from Yemen are Senegalese (14.2%, a difference of 0.080%), Soviet Union (14.2%, a difference of 0.41%), Ecuadorian (14.1%, a difference of 1.3%), Immigrants from Albania (14.0%, a difference of 2.0%), and Immigrants from Caribbean (14.6%, a difference of 2.3%).
| Demographics | Rating | Rank | 3 or more Vehicles in Household |
| Jamaicans | 0.0 /100 | #317 | Tragic 15.2% |
| Immigrants | Haiti | 0.0 /100 | #318 | Tragic 15.2% |
| Cape Verdeans | 0.0 /100 | #319 | Tragic 15.0% |
| Yup'ik | 0.0 /100 | #320 | Tragic 14.8% |
| Immigrants | Jamaica | 0.0 /100 | #321 | Tragic 14.7% |
| Immigrants | West Indies | 0.0 /100 | #322 | Tragic 14.6% |
| Immigrants | Caribbean | 0.0 /100 | #323 | Tragic 14.6% |
| Immigrants | Yemen | 0.0 /100 | #324 | Tragic 14.2% |
| Senegalese | 0.0 /100 | #325 | Tragic 14.2% |
| Soviet Union | 0.0 /100 | #326 | Tragic 14.2% |
| Ecuadorians | 0.0 /100 | #327 | Tragic 14.1% |
| Immigrants | Albania | 0.0 /100 | #328 | Tragic 14.0% |
| Immigrants | Senegal | 0.0 /100 | #329 | Tragic 13.8% |
| West Indians | 0.0 /100 | #330 | Tragic 13.7% |
| Immigrants | Dominica | 0.0 /100 | #331 | Tragic 13.7% |