Armenian vs Immigrants from Yemen In Labor Force | Age 25-29
COMPARE
Armenian
Immigrants from Yemen
In Labor Force | Age 25-29
In Labor Force | Age 25-29 Comparison
Armenians
Immigrants from Yemen
84.8%
IN LABOR FORCE | AGE 25-29
72.7/ 100
METRIC RATING
138th/ 347
METRIC RANK
78.2%
IN LABOR FORCE | AGE 25-29
0.0/ 100
METRIC RATING
339th/ 347
METRIC RANK
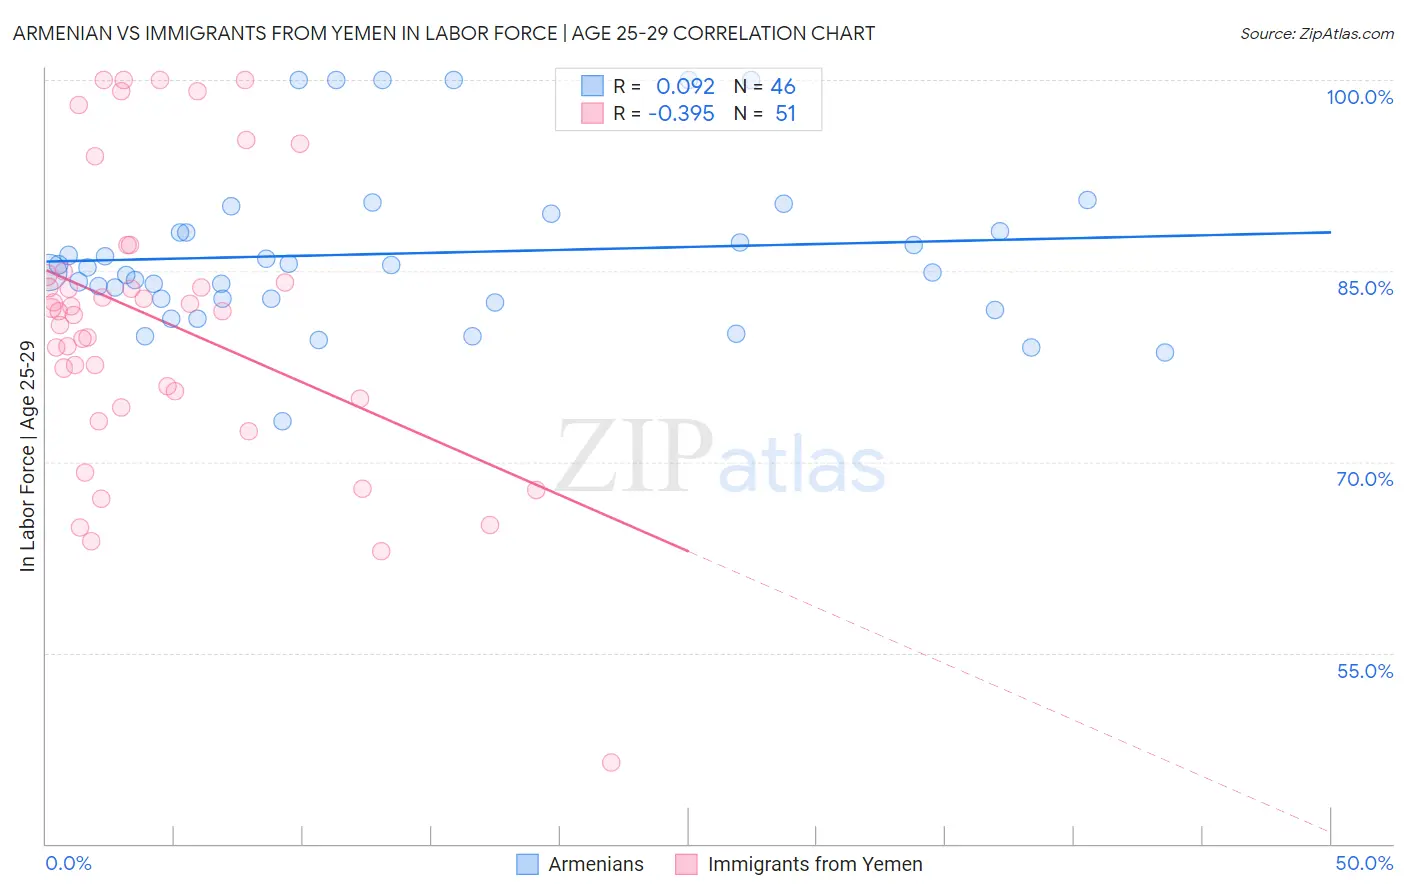
Armenian vs Immigrants from Yemen In Labor Force | Age 25-29 Correlation Chart
The statistical analysis conducted on geographies consisting of 310,863,376 people shows a slight positive correlation between the proportion of Armenians and labor force participation rate among population between the ages 25 and 29 in the United States with a correlation coefficient (R) of 0.092 and weighted average of 84.8%. Similarly, the statistical analysis conducted on geographies consisting of 82,433,611 people shows a mild negative correlation between the proportion of Immigrants from Yemen and labor force participation rate among population between the ages 25 and 29 in the United States with a correlation coefficient (R) of -0.395 and weighted average of 78.2%, a difference of 8.4%.
In Labor Force | Age 25-29 Correlation Summary
| Measurement | Armenian | Immigrants from Yemen |
| Minimum | 73.2% | 46.4% |
| Maximum | 100.0% | 100.0% |
| Range | 26.8% | 53.6% |
| Mean | 86.4% | 81.1% |
| Median | 85.1% | 81.9% |
| Interquartile 25% (IQ1) | 82.8% | 75.0% |
| Interquartile 75% (IQ3) | 88.1% | 85.0% |
| Interquartile Range (IQR) | 5.3% | 10.0% |
| Standard Deviation (Sample) | 6.4% | 11.4% |
| Standard Deviation (Population) | 6.3% | 11.2% |
Similar Demographics by In Labor Force | Age 25-29
Demographics Similar to Armenians by In Labor Force | Age 25-29
In terms of in labor force | age 25-29, the demographic groups most similar to Armenians are Immigrants from Eastern Asia (84.8%, a difference of 0.0%), Immigrants from Canada (84.8%, a difference of 0.010%), Immigrants from North America (84.8%, a difference of 0.010%), Danish (84.8%, a difference of 0.010%), and Pakistani (84.8%, a difference of 0.020%).
| Demographics | Rating | Rank | In Labor Force | Age 25-29 |
| Iranians | 78.1 /100 | #131 | Good 84.8% |
| Romanians | 77.7 /100 | #132 | Good 84.8% |
| Asians | 77.7 /100 | #133 | Good 84.8% |
| Syrians | 76.5 /100 | #134 | Good 84.8% |
| Immigrants | Hungary | 76.4 /100 | #135 | Good 84.8% |
| Bhutanese | 76.0 /100 | #136 | Good 84.8% |
| Immigrants | Canada | 73.5 /100 | #137 | Good 84.8% |
| Armenians | 72.7 /100 | #138 | Good 84.8% |
| Immigrants | Eastern Asia | 72.6 /100 | #139 | Good 84.8% |
| Immigrants | North America | 72.1 /100 | #140 | Good 84.8% |
| Danes | 71.9 /100 | #141 | Good 84.8% |
| Pakistanis | 70.0 /100 | #142 | Good 84.8% |
| Sri Lankans | 69.2 /100 | #143 | Good 84.8% |
| Immigrants | Laos | 69.0 /100 | #144 | Good 84.8% |
| Immigrants | Senegal | 68.3 /100 | #145 | Good 84.8% |
Demographics Similar to Immigrants from Yemen by In Labor Force | Age 25-29
In terms of in labor force | age 25-29, the demographic groups most similar to Immigrants from Yemen are Lumbee (78.3%, a difference of 0.12%), Paiute (78.1%, a difference of 0.16%), Crow (78.6%, a difference of 0.49%), Tohono O'odham (77.5%, a difference of 0.94%), and Pueblo (77.5%, a difference of 0.96%).
| Demographics | Rating | Rank | In Labor Force | Age 25-29 |
| Inupiat | 0.0 /100 | #332 | Tragic 79.8% |
| Sioux | 0.0 /100 | #333 | Tragic 79.7% |
| Yuman | 0.0 /100 | #334 | Tragic 79.3% |
| Natives/Alaskans | 0.0 /100 | #335 | Tragic 79.3% |
| Apache | 0.0 /100 | #336 | Tragic 79.2% |
| Crow | 0.0 /100 | #337 | Tragic 78.6% |
| Lumbee | 0.0 /100 | #338 | Tragic 78.3% |
| Immigrants | Yemen | 0.0 /100 | #339 | Tragic 78.2% |
| Paiute | 0.0 /100 | #340 | Tragic 78.1% |
| Tohono O'odham | 0.0 /100 | #341 | Tragic 77.5% |
| Pueblo | 0.0 /100 | #342 | Tragic 77.5% |
| Arapaho | 0.0 /100 | #343 | Tragic 76.6% |
| Hopi | 0.0 /100 | #344 | Tragic 76.5% |
| Navajo | 0.0 /100 | #345 | Tragic 74.6% |
| Pima | 0.0 /100 | #346 | Tragic 74.3% |