Immigrants from Barbados vs Hungarian 3 or more Vehicles in Household
COMPARE
Immigrants from Barbados
Hungarian
3 or more Vehicles in Household
3 or more Vehicles in Household Comparison
Immigrants from Barbados
Hungarians
11.7%
3 OR MORE VEHICLES IN HOUSEHOLD
0.0/ 100
METRIC RATING
340th/ 347
METRIC RANK
19.8%
3 OR MORE VEHICLES IN HOUSEHOLD
70.5/ 100
METRIC RATING
157th/ 347
METRIC RANK
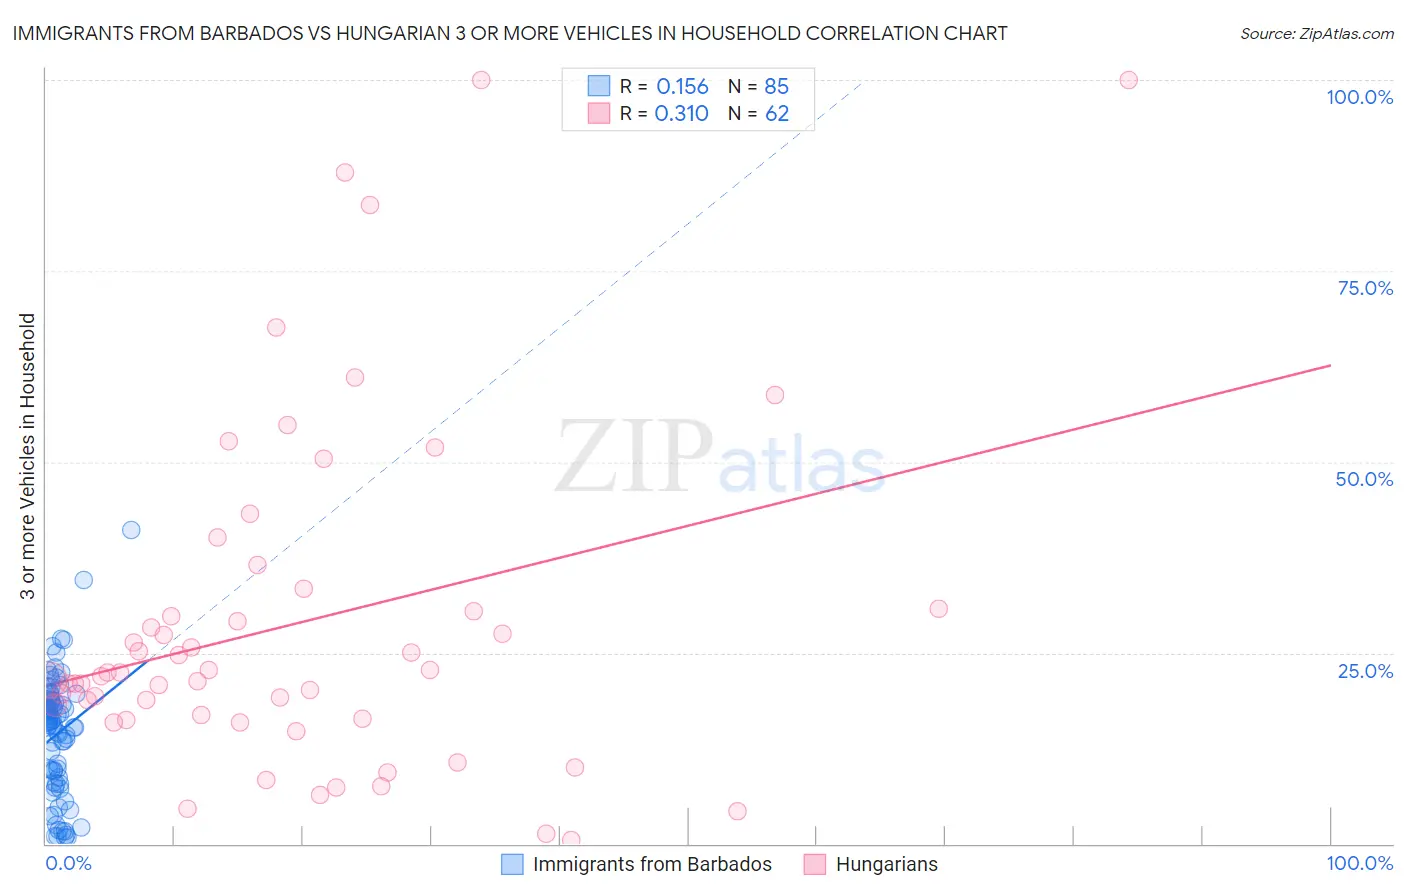
Immigrants from Barbados vs Hungarian 3 or more Vehicles in Household Correlation Chart
The statistical analysis conducted on geographies consisting of 112,763,977 people shows a poor positive correlation between the proportion of Immigrants from Barbados and percentage of households with 3 or more vehicles available in the United States with a correlation coefficient (R) of 0.156 and weighted average of 11.7%. Similarly, the statistical analysis conducted on geographies consisting of 485,698,849 people shows a mild positive correlation between the proportion of Hungarians and percentage of households with 3 or more vehicles available in the United States with a correlation coefficient (R) of 0.310 and weighted average of 19.8%, a difference of 69.1%.
3 or more Vehicles in Household Correlation Summary
| Measurement | Immigrants from Barbados | Hungarian |
| Minimum | 0.77% | 0.54% |
| Maximum | 41.1% | 100.0% |
| Range | 40.3% | 99.5% |
| Mean | 14.4% | 28.9% |
| Median | 15.9% | 22.2% |
| Interquartile 25% (IQ1) | 8.3% | 16.4% |
| Interquartile 75% (IQ3) | 18.8% | 30.8% |
| Interquartile Range (IQR) | 10.5% | 14.4% |
| Standard Deviation (Sample) | 7.8% | 22.4% |
| Standard Deviation (Population) | 7.8% | 22.2% |
Similar Demographics by 3 or more Vehicles in Household
Demographics Similar to Immigrants from Barbados by 3 or more Vehicles in Household
In terms of 3 or more vehicles in household, the demographic groups most similar to Immigrants from Barbados are Immigrants from Uzbekistan (12.0%, a difference of 2.2%), Guyanese (11.5%, a difference of 2.4%), British West Indian (11.4%, a difference of 2.4%), Immigrants from Guyana (11.2%, a difference of 4.3%), and Dominican (11.2%, a difference of 4.4%).
| Demographics | Rating | Rank | 3 or more Vehicles in Household |
| Immigrants | Cabo Verde | 0.0 /100 | #333 | Tragic 13.6% |
| Immigrants | Ecuador | 0.0 /100 | #334 | Tragic 13.4% |
| Immigrants | Trinidad and Tobago | 0.0 /100 | #335 | Tragic 13.3% |
| Barbadians | 0.0 /100 | #336 | Tragic 12.6% |
| Immigrants | Bangladesh | 0.0 /100 | #337 | Tragic 12.5% |
| Vietnamese | 0.0 /100 | #338 | Tragic 12.5% |
| Immigrants | Uzbekistan | 0.0 /100 | #339 | Tragic 12.0% |
| Immigrants | Barbados | 0.0 /100 | #340 | Tragic 11.7% |
| Guyanese | 0.0 /100 | #341 | Tragic 11.5% |
| British West Indians | 0.0 /100 | #342 | Tragic 11.4% |
| Immigrants | Guyana | 0.0 /100 | #343 | Tragic 11.2% |
| Dominicans | 0.0 /100 | #344 | Tragic 11.2% |
| Immigrants | Dominican Republic | 0.0 /100 | #345 | Tragic 10.4% |
| Immigrants | St. Vincent and the Grenadines | 0.0 /100 | #346 | Tragic 10.1% |
| Immigrants | Grenada | 0.0 /100 | #347 | Tragic 9.1% |
Demographics Similar to Hungarians by 3 or more Vehicles in Household
In terms of 3 or more vehicles in household, the demographic groups most similar to Hungarians are Thai (19.8%, a difference of 0.050%), Armenian (19.8%, a difference of 0.15%), Immigrants from Pakistan (19.8%, a difference of 0.21%), Tlingit-Haida (19.9%, a difference of 0.26%), and Immigrants from Lebanon (19.8%, a difference of 0.26%).
| Demographics | Rating | Rank | 3 or more Vehicles in Household |
| Immigrants | Immigrants | 80.8 /100 | #150 | Excellent 20.0% |
| Taiwanese | 80.6 /100 | #151 | Excellent 20.0% |
| Lebanese | 79.8 /100 | #152 | Good 20.0% |
| Yuman | 75.6 /100 | #153 | Good 19.9% |
| Immigrants | Jordan | 75.0 /100 | #154 | Good 19.9% |
| Tlingit-Haida | 73.4 /100 | #155 | Good 19.9% |
| Thais | 71.1 /100 | #156 | Good 19.8% |
| Hungarians | 70.5 /100 | #157 | Good 19.8% |
| Armenians | 68.8 /100 | #158 | Good 19.8% |
| Immigrants | Pakistan | 68.2 /100 | #159 | Good 19.8% |
| Immigrants | Lebanon | 67.6 /100 | #160 | Good 19.8% |
| Immigrants | Guatemala | 65.6 /100 | #161 | Good 19.7% |
| Estonians | 63.2 /100 | #162 | Good 19.7% |
| Chileans | 63.0 /100 | #163 | Good 19.7% |
| Yugoslavians | 62.9 /100 | #164 | Good 19.7% |