Pima vs Hungarian 3 or more Vehicles in Household
COMPARE
Pima
Hungarian
3 or more Vehicles in Household
3 or more Vehicles in Household Comparison
Pima
Hungarians
22.0%
3 OR MORE VEHICLES IN HOUSEHOLD
99.9/ 100
METRIC RATING
65th/ 347
METRIC RANK
19.8%
3 OR MORE VEHICLES IN HOUSEHOLD
70.5/ 100
METRIC RATING
157th/ 347
METRIC RANK
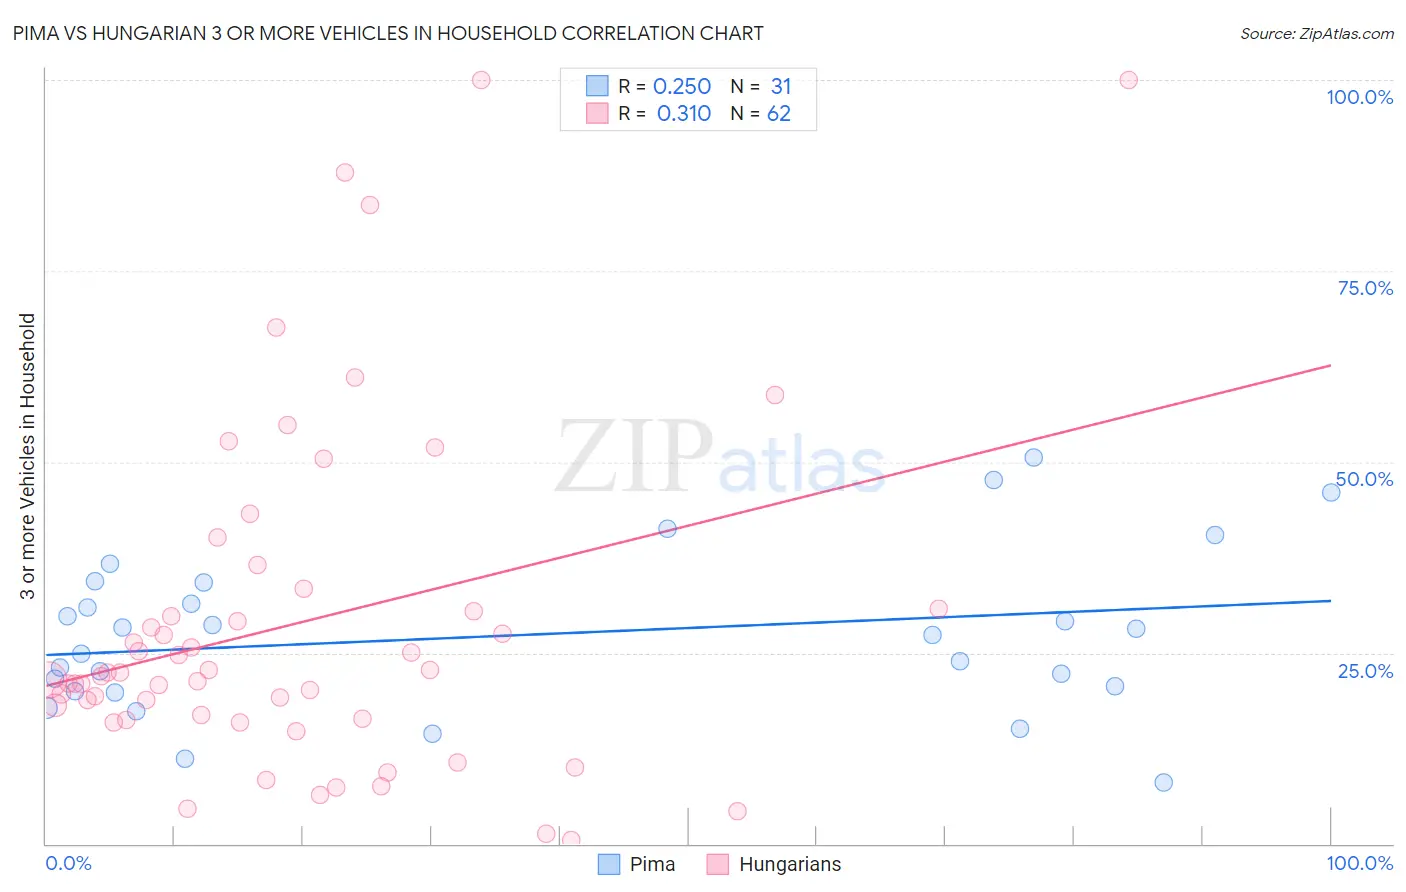
Pima vs Hungarian 3 or more Vehicles in Household Correlation Chart
The statistical analysis conducted on geographies consisting of 61,538,722 people shows a weak positive correlation between the proportion of Pima and percentage of households with 3 or more vehicles available in the United States with a correlation coefficient (R) of 0.250 and weighted average of 22.0%. Similarly, the statistical analysis conducted on geographies consisting of 485,698,849 people shows a mild positive correlation between the proportion of Hungarians and percentage of households with 3 or more vehicles available in the United States with a correlation coefficient (R) of 0.310 and weighted average of 19.8%, a difference of 11.2%.
3 or more Vehicles in Household Correlation Summary
| Measurement | Pima | Hungarian |
| Minimum | 8.0% | 0.54% |
| Maximum | 50.5% | 100.0% |
| Range | 42.6% | 99.5% |
| Mean | 27.3% | 28.9% |
| Median | 27.3% | 22.2% |
| Interquartile 25% (IQ1) | 20.0% | 16.4% |
| Interquartile 75% (IQ3) | 34.1% | 30.8% |
| Interquartile Range (IQR) | 14.2% | 14.4% |
| Standard Deviation (Sample) | 10.5% | 22.4% |
| Standard Deviation (Population) | 10.3% | 22.2% |
Similar Demographics by 3 or more Vehicles in Household
Demographics Similar to Pima by 3 or more Vehicles in Household
In terms of 3 or more vehicles in household, the demographic groups most similar to Pima are Northern European (22.0%, a difference of 0.14%), Alaskan Athabascan (21.9%, a difference of 0.40%), Immigrants from Taiwan (22.1%, a difference of 0.42%), British (21.9%, a difference of 0.55%), and Creek (21.9%, a difference of 0.58%).
| Demographics | Rating | Rank | 3 or more Vehicles in Household |
| Spaniards | 100.0 /100 | #58 | Exceptional 22.3% |
| Navajo | 100.0 /100 | #59 | Exceptional 22.3% |
| Finns | 99.9 /100 | #60 | Exceptional 22.3% |
| Bhutanese | 99.9 /100 | #61 | Exceptional 22.2% |
| Fijians | 99.9 /100 | #62 | Exceptional 22.2% |
| Chickasaw | 99.9 /100 | #63 | Exceptional 22.2% |
| Immigrants | Taiwan | 99.9 /100 | #64 | Exceptional 22.1% |
| Pima | 99.9 /100 | #65 | Exceptional 22.0% |
| Northern Europeans | 99.9 /100 | #66 | Exceptional 22.0% |
| Alaskan Athabascans | 99.9 /100 | #67 | Exceptional 21.9% |
| British | 99.9 /100 | #68 | Exceptional 21.9% |
| Creek | 99.9 /100 | #69 | Exceptional 21.9% |
| Bangladeshis | 99.8 /100 | #70 | Exceptional 21.9% |
| Potawatomi | 99.8 /100 | #71 | Exceptional 21.9% |
| Portuguese | 99.8 /100 | #72 | Exceptional 21.8% |
Demographics Similar to Hungarians by 3 or more Vehicles in Household
In terms of 3 or more vehicles in household, the demographic groups most similar to Hungarians are Thai (19.8%, a difference of 0.050%), Armenian (19.8%, a difference of 0.15%), Immigrants from Pakistan (19.8%, a difference of 0.21%), Tlingit-Haida (19.9%, a difference of 0.26%), and Immigrants from Lebanon (19.8%, a difference of 0.26%).
| Demographics | Rating | Rank | 3 or more Vehicles in Household |
| Immigrants | Immigrants | 80.8 /100 | #150 | Excellent 20.0% |
| Taiwanese | 80.6 /100 | #151 | Excellent 20.0% |
| Lebanese | 79.8 /100 | #152 | Good 20.0% |
| Yuman | 75.6 /100 | #153 | Good 19.9% |
| Immigrants | Jordan | 75.0 /100 | #154 | Good 19.9% |
| Tlingit-Haida | 73.4 /100 | #155 | Good 19.9% |
| Thais | 71.1 /100 | #156 | Good 19.8% |
| Hungarians | 70.5 /100 | #157 | Good 19.8% |
| Armenians | 68.8 /100 | #158 | Good 19.8% |
| Immigrants | Pakistan | 68.2 /100 | #159 | Good 19.8% |
| Immigrants | Lebanon | 67.6 /100 | #160 | Good 19.8% |
| Immigrants | Guatemala | 65.6 /100 | #161 | Good 19.7% |
| Estonians | 63.2 /100 | #162 | Good 19.7% |
| Chileans | 63.0 /100 | #163 | Good 19.7% |
| Yugoslavians | 62.9 /100 | #164 | Good 19.7% |