Zimbabwean vs Nonimmigrants Single Female Poverty
COMPARE
Zimbabwean
Nonimmigrants
Single Female Poverty
Single Female Poverty Comparison
Zimbabweans
Nonimmigrants
19.5%
SINGLE FEMALE POVERTY
99.0/ 100
METRIC RATING
87th/ 347
METRIC RANK
23.6%
SINGLE FEMALE POVERTY
0.0/ 100
METRIC RATING
278th/ 347
METRIC RANK
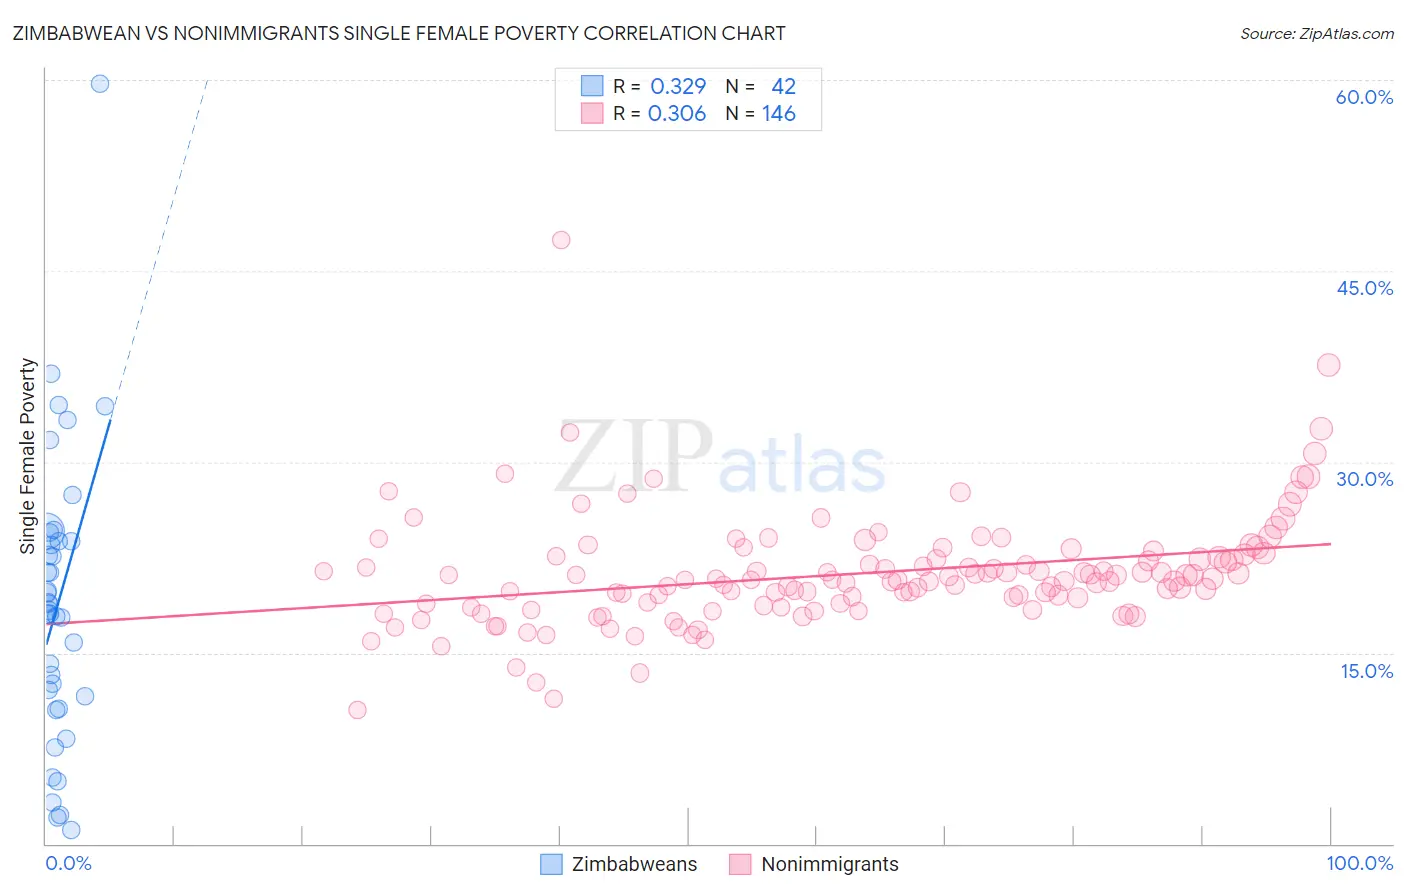
Zimbabwean vs Nonimmigrants Single Female Poverty Correlation Chart
The statistical analysis conducted on geographies consisting of 69,078,290 people shows a mild positive correlation between the proportion of Zimbabweans and poverty level among single females in the United States with a correlation coefficient (R) of 0.329 and weighted average of 19.5%. Similarly, the statistical analysis conducted on geographies consisting of 561,693,652 people shows a mild positive correlation between the proportion of Nonimmigrants and poverty level among single females in the United States with a correlation coefficient (R) of 0.306 and weighted average of 23.6%, a difference of 20.9%.
Single Female Poverty Correlation Summary
| Measurement | Zimbabwean | Nonimmigrants |
| Minimum | 1.1% | 10.5% |
| Maximum | 59.7% | 47.5% |
| Range | 58.6% | 36.9% |
| Mean | 18.9% | 21.2% |
| Median | 18.6% | 20.7% |
| Interquartile 25% (IQ1) | 11.6% | 18.9% |
| Interquartile 75% (IQ3) | 23.8% | 22.6% |
| Interquartile Range (IQR) | 12.2% | 3.8% |
| Standard Deviation (Sample) | 11.3% | 4.4% |
| Standard Deviation (Population) | 11.1% | 4.4% |
Similar Demographics by Single Female Poverty
Demographics Similar to Zimbabweans by Single Female Poverty
In terms of single female poverty, the demographic groups most similar to Zimbabweans are Afghan (19.5%, a difference of 0.020%), Immigrants from Ukraine (19.5%, a difference of 0.030%), Immigrants from Lebanon (19.6%, a difference of 0.20%), Soviet Union (19.6%, a difference of 0.27%), and Italian (19.6%, a difference of 0.31%).
| Demographics | Rating | Rank | Single Female Poverty |
| Immigrants | Australia | 99.3 /100 | #80 | Exceptional 19.4% |
| Immigrants | Scotland | 99.2 /100 | #81 | Exceptional 19.4% |
| Immigrants | Malaysia | 99.2 /100 | #82 | Exceptional 19.4% |
| Taiwanese | 99.2 /100 | #83 | Exceptional 19.4% |
| Immigrants | Sweden | 99.2 /100 | #84 | Exceptional 19.4% |
| Immigrants | Albania | 99.2 /100 | #85 | Exceptional 19.4% |
| Greeks | 99.2 /100 | #86 | Exceptional 19.4% |
| Zimbabweans | 99.0 /100 | #87 | Exceptional 19.5% |
| Afghans | 99.0 /100 | #88 | Exceptional 19.5% |
| Immigrants | Ukraine | 99.0 /100 | #89 | Exceptional 19.5% |
| Immigrants | Lebanon | 98.8 /100 | #90 | Exceptional 19.6% |
| Soviet Union | 98.8 /100 | #91 | Exceptional 19.6% |
| Italians | 98.8 /100 | #92 | Exceptional 19.6% |
| Immigrants | Austria | 98.8 /100 | #93 | Exceptional 19.6% |
| Romanians | 98.6 /100 | #94 | Exceptional 19.6% |
Demographics Similar to Nonimmigrants by Single Female Poverty
In terms of single female poverty, the demographic groups most similar to Nonimmigrants are Alaskan Athabascan (23.6%, a difference of 0.040%), Pennsylvania German (23.6%, a difference of 0.080%), Immigrants from the Azores (23.5%, a difference of 0.23%), Immigrants from Latin America (23.7%, a difference of 0.53%), and Mexican American Indian (23.4%, a difference of 1.0%).
| Demographics | Rating | Rank | Single Female Poverty |
| Sub-Saharan Africans | 0.1 /100 | #271 | Tragic 23.2% |
| Immigrants | Senegal | 0.1 /100 | #272 | Tragic 23.2% |
| Alaska Natives | 0.1 /100 | #273 | Tragic 23.3% |
| Marshallese | 0.1 /100 | #274 | Tragic 23.3% |
| Mexican American Indians | 0.1 /100 | #275 | Tragic 23.4% |
| Immigrants | Azores | 0.0 /100 | #276 | Tragic 23.5% |
| Pennsylvania Germans | 0.0 /100 | #277 | Tragic 23.6% |
| Immigrants | Nonimmigrants | 0.0 /100 | #278 | Tragic 23.6% |
| Alaskan Athabascans | 0.0 /100 | #279 | Tragic 23.6% |
| Immigrants | Latin America | 0.0 /100 | #280 | Tragic 23.7% |
| Immigrants | Zaire | 0.0 /100 | #281 | Tragic 23.8% |
| Guatemalans | 0.0 /100 | #282 | Tragic 23.8% |
| German Russians | 0.0 /100 | #283 | Tragic 23.9% |
| Immigrants | Dominica | 0.0 /100 | #284 | Tragic 23.9% |
| Immigrants | Guatemala | 0.0 /100 | #285 | Tragic 24.1% |