Zimbabwean vs Nonimmigrants Unemployment Among Seniors over 75 years
COMPARE
Zimbabwean
Nonimmigrants
Unemployment Among Seniors over 75 years
Unemployment Among Seniors over 75 years Comparison
Zimbabweans
Nonimmigrants
8.7%
UNEMPLOYMENT AMONG SENIORS OVER 75 YEARS
54.1/ 100
METRIC RATING
170th/ 347
METRIC RANK
9.8%
UNEMPLOYMENT AMONG SENIORS OVER 75 YEARS
0.0/ 100
METRIC RATING
295th/ 347
METRIC RANK
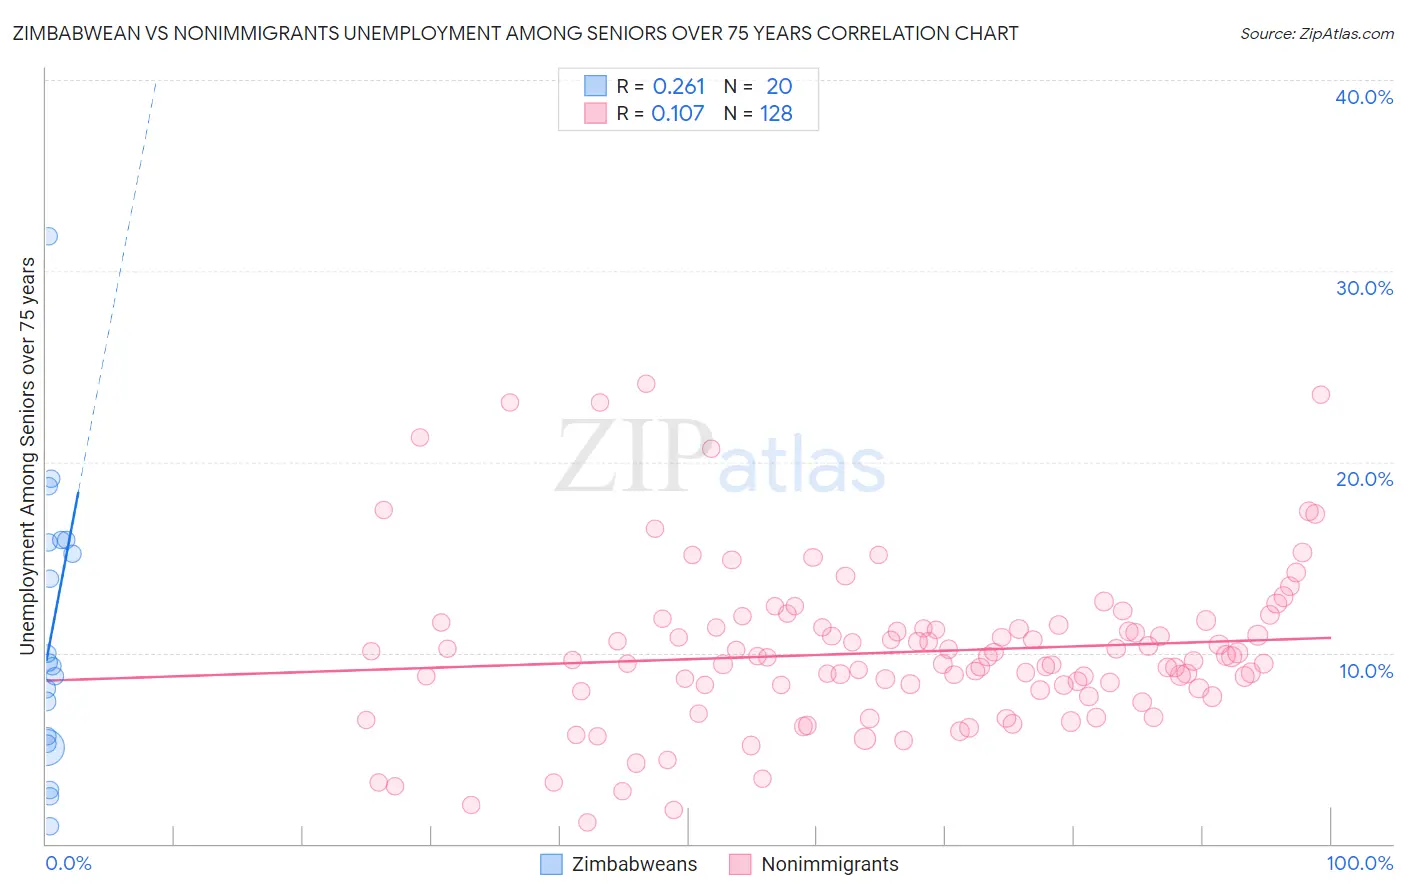
Zimbabwean vs Nonimmigrants Unemployment Among Seniors over 75 years Correlation Chart
The statistical analysis conducted on geographies consisting of 56,538,105 people shows a weak positive correlation between the proportion of Zimbabweans and unemployment rate among seniors over the age of 75 in the United States with a correlation coefficient (R) of 0.261 and weighted average of 8.7%. Similarly, the statistical analysis conducted on geographies consisting of 234,788,716 people shows a poor positive correlation between the proportion of Nonimmigrants and unemployment rate among seniors over the age of 75 in the United States with a correlation coefficient (R) of 0.107 and weighted average of 9.8%, a difference of 12.7%.
Unemployment Among Seniors over 75 years Correlation Summary
| Measurement | Zimbabwean | Nonimmigrants |
| Minimum | 0.90% | 1.1% |
| Maximum | 31.8% | 24.1% |
| Range | 30.9% | 23.0% |
| Mean | 11.1% | 10.0% |
| Median | 9.4% | 9.7% |
| Interquartile 25% (IQ1) | 5.4% | 8.1% |
| Interquartile 75% (IQ3) | 15.8% | 11.3% |
| Interquartile Range (IQR) | 10.4% | 3.2% |
| Standard Deviation (Sample) | 7.4% | 4.2% |
| Standard Deviation (Population) | 7.2% | 4.2% |
Similar Demographics by Unemployment Among Seniors over 75 years
Demographics Similar to Zimbabweans by Unemployment Among Seniors over 75 years
In terms of unemployment among seniors over 75 years, the demographic groups most similar to Zimbabweans are Dominican (8.7%, a difference of 0.12%), Immigrants (8.7%, a difference of 0.12%), Fijian (8.7%, a difference of 0.13%), Immigrants from Lithuania (8.7%, a difference of 0.17%), and Immigrants from Belize (8.7%, a difference of 0.19%).
| Demographics | Rating | Rank | Unemployment Among Seniors over 75 years |
| Immigrants | Guatemala | 68.4 /100 | #163 | Good 8.7% |
| Paraguayans | 62.2 /100 | #164 | Good 8.7% |
| Immigrants | Dominican Republic | 61.4 /100 | #165 | Good 8.7% |
| Immigrants | Belize | 57.6 /100 | #166 | Average 8.7% |
| Immigrants | Eastern Africa | 57.6 /100 | #167 | Average 8.7% |
| Immigrants | Lithuania | 57.2 /100 | #168 | Average 8.7% |
| Fijians | 56.4 /100 | #169 | Average 8.7% |
| Zimbabweans | 54.1 /100 | #170 | Average 8.7% |
| Dominicans | 51.9 /100 | #171 | Average 8.7% |
| Immigrants | Immigrants | 51.8 /100 | #172 | Average 8.7% |
| Australians | 50.3 /100 | #173 | Average 8.7% |
| Immigrants | El Salvador | 49.7 /100 | #174 | Average 8.7% |
| Syrians | 49.6 /100 | #175 | Average 8.7% |
| Somalis | 45.3 /100 | #176 | Average 8.8% |
| Central Americans | 43.3 /100 | #177 | Average 8.8% |
Demographics Similar to Nonimmigrants by Unemployment Among Seniors over 75 years
In terms of unemployment among seniors over 75 years, the demographic groups most similar to Nonimmigrants are Immigrants from St. Vincent and the Grenadines (9.8%, a difference of 0.050%), Cherokee (9.8%, a difference of 0.13%), Immigrants from Dominica (9.8%, a difference of 0.36%), Norwegian (9.8%, a difference of 0.42%), and Lithuanian (9.9%, a difference of 0.51%).
| Demographics | Rating | Rank | Unemployment Among Seniors over 75 years |
| Canadians | 0.0 /100 | #288 | Tragic 9.7% |
| Czechs | 0.0 /100 | #289 | Tragic 9.7% |
| Sioux | 0.0 /100 | #290 | Tragic 9.7% |
| Scandinavians | 0.0 /100 | #291 | Tragic 9.7% |
| Immigrants | Western Africa | 0.0 /100 | #292 | Tragic 9.8% |
| Norwegians | 0.0 /100 | #293 | Tragic 9.8% |
| Immigrants | Dominica | 0.0 /100 | #294 | Tragic 9.8% |
| Immigrants | Nonimmigrants | 0.0 /100 | #295 | Tragic 9.8% |
| Immigrants | St. Vincent and the Grenadines | 0.0 /100 | #296 | Tragic 9.8% |
| Cherokee | 0.0 /100 | #297 | Tragic 9.8% |
| Lithuanians | 0.0 /100 | #298 | Tragic 9.9% |
| Belgians | 0.0 /100 | #299 | Tragic 9.9% |
| Iraqis | 0.0 /100 | #300 | Tragic 9.9% |
| Welsh | 0.0 /100 | #301 | Tragic 10.0% |
| Finns | 0.0 /100 | #302 | Tragic 10.0% |