Zimbabwean vs Laotian Single Female Poverty
COMPARE
Zimbabwean
Laotian
Single Female Poverty
Single Female Poverty Comparison
Zimbabweans
Laotians
19.5%
SINGLE FEMALE POVERTY
99.0/ 100
METRIC RATING
87th/ 347
METRIC RANK
19.3%
SINGLE FEMALE POVERTY
99.5/ 100
METRIC RATING
68th/ 347
METRIC RANK
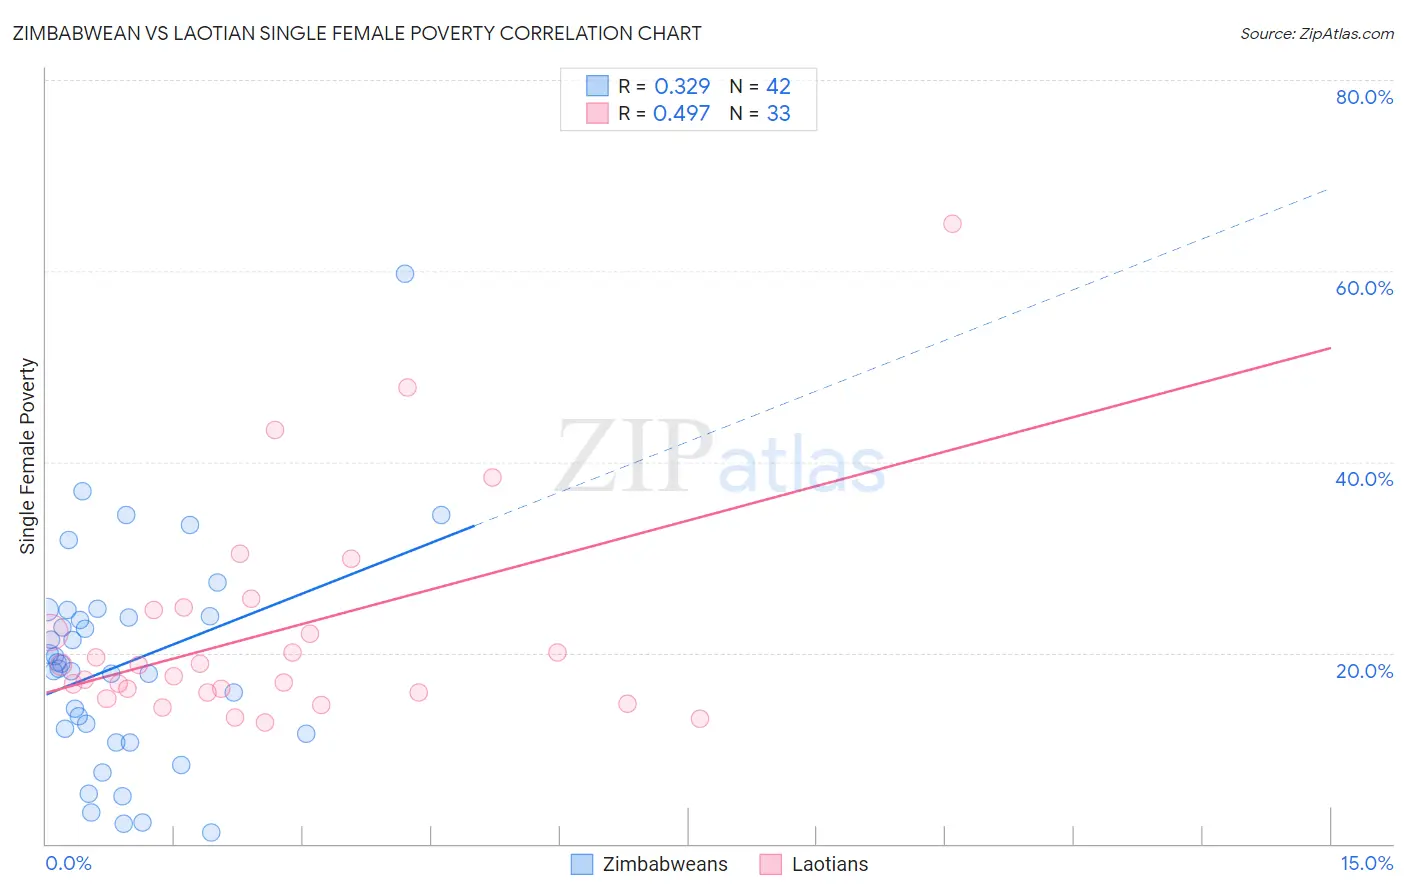
Zimbabwean vs Laotian Single Female Poverty Correlation Chart
The statistical analysis conducted on geographies consisting of 69,078,290 people shows a mild positive correlation between the proportion of Zimbabweans and poverty level among single females in the United States with a correlation coefficient (R) of 0.329 and weighted average of 19.5%. Similarly, the statistical analysis conducted on geographies consisting of 222,876,805 people shows a moderate positive correlation between the proportion of Laotians and poverty level among single females in the United States with a correlation coefficient (R) of 0.497 and weighted average of 19.3%, a difference of 1.4%.
Single Female Poverty Correlation Summary
| Measurement | Zimbabwean | Laotian |
| Minimum | 1.1% | 12.6% |
| Maximum | 59.7% | 64.9% |
| Range | 58.6% | 52.3% |
| Mean | 18.9% | 22.3% |
| Median | 18.6% | 18.7% |
| Interquartile 25% (IQ1) | 11.6% | 15.9% |
| Interquartile 75% (IQ3) | 23.8% | 24.6% |
| Interquartile Range (IQR) | 12.2% | 8.7% |
| Standard Deviation (Sample) | 11.3% | 11.4% |
| Standard Deviation (Population) | 11.1% | 11.2% |
Demographics Similar to Zimbabweans and Laotians by Single Female Poverty
In terms of single female poverty, the demographic groups most similar to Zimbabweans are Immigrants from Albania (19.4%, a difference of 0.37%), Greek (19.4%, a difference of 0.37%), Immigrants from Sweden (19.4%, a difference of 0.41%), Taiwanese (19.4%, a difference of 0.49%), and Immigrants from Malaysia (19.4%, a difference of 0.51%). Similarly, the demographic groups most similar to Laotians are Immigrants from Egypt (19.2%, a difference of 0.040%), Paraguayan (19.3%, a difference of 0.25%), Immigrants from Jordan (19.3%, a difference of 0.31%), Immigrants from South Eastern Asia (19.3%, a difference of 0.38%), and Immigrants from Latvia (19.3%, a difference of 0.39%).
| Demographics | Rating | Rank | Single Female Poverty |
| Immigrants | Egypt | 99.6 /100 | #67 | Exceptional 19.2% |
| Laotians | 99.5 /100 | #68 | Exceptional 19.3% |
| Paraguayans | 99.5 /100 | #69 | Exceptional 19.3% |
| Immigrants | Jordan | 99.4 /100 | #70 | Exceptional 19.3% |
| Immigrants | South Eastern Asia | 99.4 /100 | #71 | Exceptional 19.3% |
| Immigrants | Latvia | 99.4 /100 | #72 | Exceptional 19.3% |
| Immigrants | Peru | 99.4 /100 | #73 | Exceptional 19.3% |
| Immigrants | Belarus | 99.4 /100 | #74 | Exceptional 19.3% |
| Immigrants | Turkey | 99.4 /100 | #75 | Exceptional 19.4% |
| Peruvians | 99.4 /100 | #76 | Exceptional 19.4% |
| Immigrants | Russia | 99.3 /100 | #77 | Exceptional 19.4% |
| Albanians | 99.3 /100 | #78 | Exceptional 19.4% |
| Immigrants | Sierra Leone | 99.3 /100 | #79 | Exceptional 19.4% |
| Immigrants | Australia | 99.3 /100 | #80 | Exceptional 19.4% |
| Immigrants | Scotland | 99.2 /100 | #81 | Exceptional 19.4% |
| Immigrants | Malaysia | 99.2 /100 | #82 | Exceptional 19.4% |
| Taiwanese | 99.2 /100 | #83 | Exceptional 19.4% |
| Immigrants | Sweden | 99.2 /100 | #84 | Exceptional 19.4% |
| Immigrants | Albania | 99.2 /100 | #85 | Exceptional 19.4% |
| Greeks | 99.2 /100 | #86 | Exceptional 19.4% |
| Zimbabweans | 99.0 /100 | #87 | Exceptional 19.5% |