Zimbabwean vs Cambodian Single Female Poverty
COMPARE
Zimbabwean
Cambodian
Single Female Poverty
Single Female Poverty Comparison
Zimbabweans
Cambodians
19.5%
SINGLE FEMALE POVERTY
99.0/ 100
METRIC RATING
87th/ 347
METRIC RANK
19.2%
SINGLE FEMALE POVERTY
99.6/ 100
METRIC RATING
61st/ 347
METRIC RANK
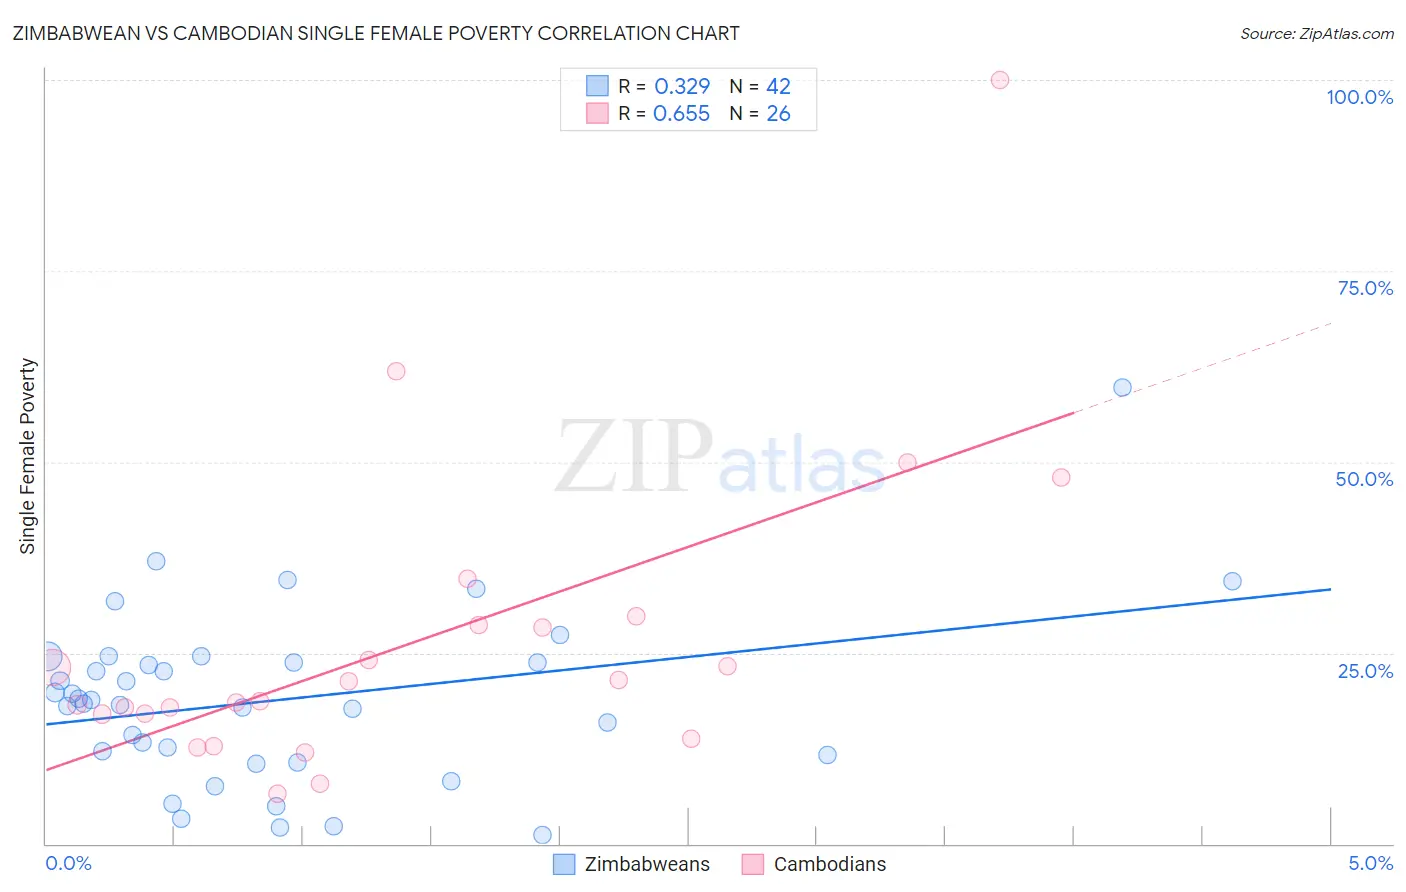
Zimbabwean vs Cambodian Single Female Poverty Correlation Chart
The statistical analysis conducted on geographies consisting of 69,078,290 people shows a mild positive correlation between the proportion of Zimbabweans and poverty level among single females in the United States with a correlation coefficient (R) of 0.329 and weighted average of 19.5%. Similarly, the statistical analysis conducted on geographies consisting of 102,115,790 people shows a significant positive correlation between the proportion of Cambodians and poverty level among single females in the United States with a correlation coefficient (R) of 0.655 and weighted average of 19.2%, a difference of 1.7%.
Single Female Poverty Correlation Summary
| Measurement | Zimbabwean | Cambodian |
| Minimum | 1.1% | 6.6% |
| Maximum | 59.7% | 100.0% |
| Range | 58.6% | 93.4% |
| Mean | 18.9% | 26.3% |
| Median | 18.6% | 19.9% |
| Interquartile 25% (IQ1) | 11.6% | 17.0% |
| Interquartile 75% (IQ3) | 23.8% | 28.6% |
| Interquartile Range (IQR) | 12.2% | 11.6% |
| Standard Deviation (Sample) | 11.3% | 19.9% |
| Standard Deviation (Population) | 11.1% | 19.5% |
Similar Demographics by Single Female Poverty
Demographics Similar to Zimbabweans by Single Female Poverty
In terms of single female poverty, the demographic groups most similar to Zimbabweans are Afghan (19.5%, a difference of 0.020%), Immigrants from Ukraine (19.5%, a difference of 0.030%), Immigrants from Lebanon (19.6%, a difference of 0.20%), Soviet Union (19.6%, a difference of 0.27%), and Italian (19.6%, a difference of 0.31%).
| Demographics | Rating | Rank | Single Female Poverty |
| Immigrants | Australia | 99.3 /100 | #80 | Exceptional 19.4% |
| Immigrants | Scotland | 99.2 /100 | #81 | Exceptional 19.4% |
| Immigrants | Malaysia | 99.2 /100 | #82 | Exceptional 19.4% |
| Taiwanese | 99.2 /100 | #83 | Exceptional 19.4% |
| Immigrants | Sweden | 99.2 /100 | #84 | Exceptional 19.4% |
| Immigrants | Albania | 99.2 /100 | #85 | Exceptional 19.4% |
| Greeks | 99.2 /100 | #86 | Exceptional 19.4% |
| Zimbabweans | 99.0 /100 | #87 | Exceptional 19.5% |
| Afghans | 99.0 /100 | #88 | Exceptional 19.5% |
| Immigrants | Ukraine | 99.0 /100 | #89 | Exceptional 19.5% |
| Immigrants | Lebanon | 98.8 /100 | #90 | Exceptional 19.6% |
| Soviet Union | 98.8 /100 | #91 | Exceptional 19.6% |
| Italians | 98.8 /100 | #92 | Exceptional 19.6% |
| Immigrants | Austria | 98.8 /100 | #93 | Exceptional 19.6% |
| Romanians | 98.6 /100 | #94 | Exceptional 19.6% |
Demographics Similar to Cambodians by Single Female Poverty
In terms of single female poverty, the demographic groups most similar to Cambodians are Russian (19.2%, a difference of 0.020%), Lithuanian (19.2%, a difference of 0.050%), Sri Lankan (19.2%, a difference of 0.12%), Immigrants from Northern Europe (19.2%, a difference of 0.17%), and Immigrants from Europe (19.2%, a difference of 0.18%).
| Demographics | Rating | Rank | Single Female Poverty |
| Argentineans | 99.7 /100 | #54 | Exceptional 19.1% |
| Immigrants | Vietnam | 99.7 /100 | #55 | Exceptional 19.1% |
| Immigrants | Fiji | 99.7 /100 | #56 | Exceptional 19.1% |
| Eastern Europeans | 99.7 /100 | #57 | Exceptional 19.1% |
| Immigrants | Bulgaria | 99.7 /100 | #58 | Exceptional 19.1% |
| Sri Lankans | 99.6 /100 | #59 | Exceptional 19.2% |
| Russians | 99.6 /100 | #60 | Exceptional 19.2% |
| Cambodians | 99.6 /100 | #61 | Exceptional 19.2% |
| Lithuanians | 99.6 /100 | #62 | Exceptional 19.2% |
| Immigrants | Northern Europe | 99.6 /100 | #63 | Exceptional 19.2% |
| Immigrants | Europe | 99.6 /100 | #64 | Exceptional 19.2% |
| Cypriots | 99.6 /100 | #65 | Exceptional 19.2% |
| Palestinians | 99.6 /100 | #66 | Exceptional 19.2% |
| Immigrants | Egypt | 99.6 /100 | #67 | Exceptional 19.2% |
| Laotians | 99.5 /100 | #68 | Exceptional 19.3% |