Venezuelan vs Nonimmigrants Single Female Poverty
COMPARE
Venezuelan
Nonimmigrants
Single Female Poverty
Single Female Poverty Comparison
Venezuelans
Nonimmigrants
20.4%
SINGLE FEMALE POVERTY
85.5/ 100
METRIC RATING
146th/ 347
METRIC RANK
23.6%
SINGLE FEMALE POVERTY
0.0/ 100
METRIC RATING
278th/ 347
METRIC RANK
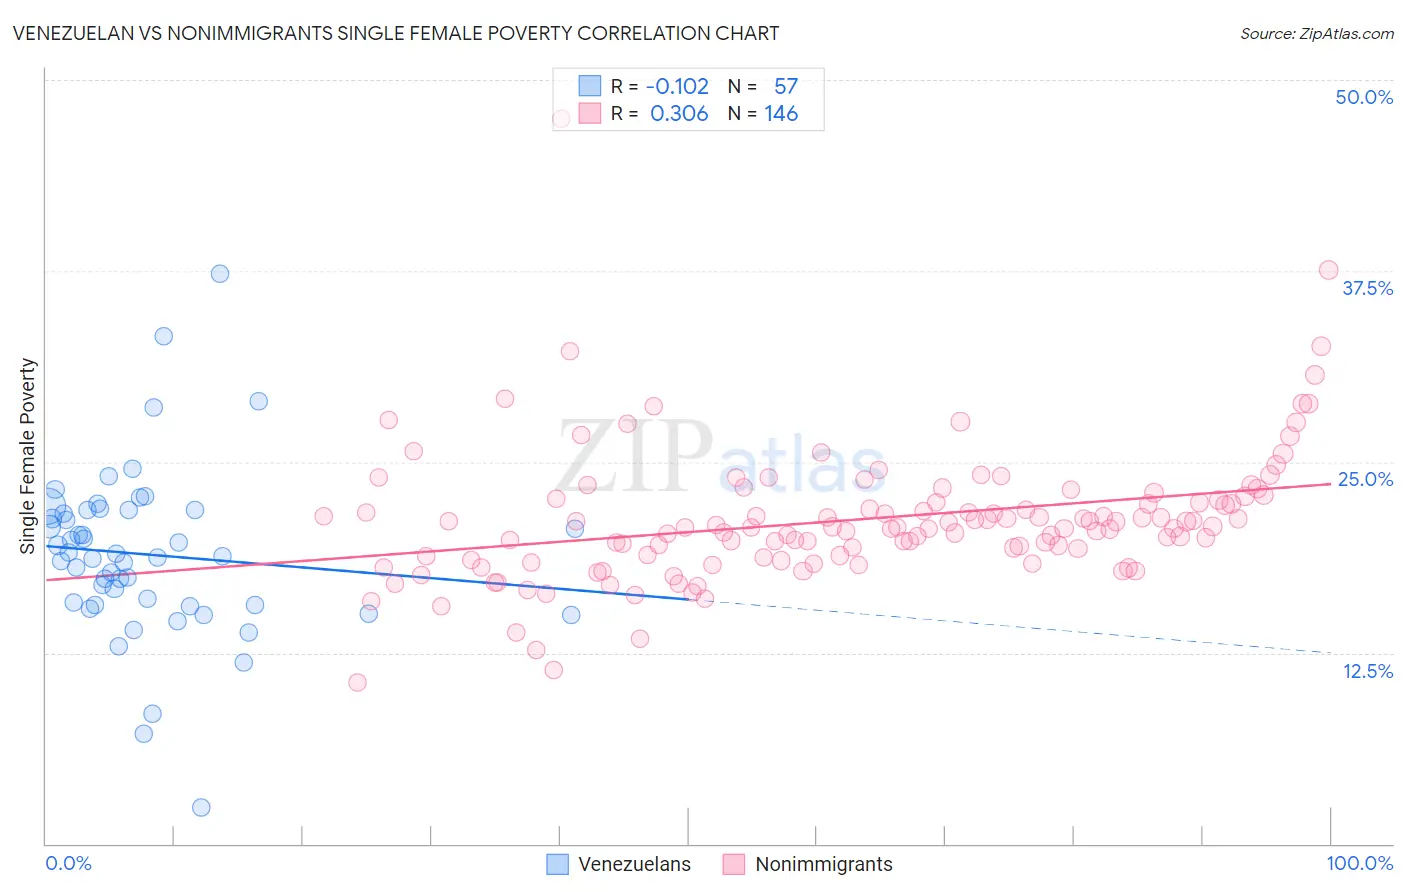
Venezuelan vs Nonimmigrants Single Female Poverty Correlation Chart
The statistical analysis conducted on geographies consisting of 303,310,735 people shows a poor negative correlation between the proportion of Venezuelans and poverty level among single females in the United States with a correlation coefficient (R) of -0.102 and weighted average of 20.4%. Similarly, the statistical analysis conducted on geographies consisting of 561,693,652 people shows a mild positive correlation between the proportion of Nonimmigrants and poverty level among single females in the United States with a correlation coefficient (R) of 0.306 and weighted average of 23.6%, a difference of 15.5%.
Single Female Poverty Correlation Summary
| Measurement | Venezuelan | Nonimmigrants |
| Minimum | 2.3% | 10.5% |
| Maximum | 37.3% | 47.5% |
| Range | 35.0% | 36.9% |
| Mean | 18.9% | 21.2% |
| Median | 18.8% | 20.7% |
| Interquartile 25% (IQ1) | 15.6% | 18.9% |
| Interquartile 75% (IQ3) | 21.8% | 22.6% |
| Interquartile Range (IQR) | 6.2% | 3.8% |
| Standard Deviation (Sample) | 5.6% | 4.4% |
| Standard Deviation (Population) | 5.5% | 4.4% |
Similar Demographics by Single Female Poverty
Demographics Similar to Venezuelans by Single Female Poverty
In terms of single female poverty, the demographic groups most similar to Venezuelans are Austrian (20.4%, a difference of 0.030%), South African (20.4%, a difference of 0.030%), Luxembourger (20.4%, a difference of 0.080%), Immigrants from Uzbekistan (20.3%, a difference of 0.39%), and Australian (20.3%, a difference of 0.40%).
| Demographics | Rating | Rank | Single Female Poverty |
| Immigrants | Kuwait | 90.4 /100 | #139 | Exceptional 20.3% |
| Syrians | 90.4 /100 | #140 | Exceptional 20.3% |
| Immigrants | North America | 89.5 /100 | #141 | Excellent 20.3% |
| Immigrants | Uganda | 89.1 /100 | #142 | Excellent 20.3% |
| Australians | 88.4 /100 | #143 | Excellent 20.3% |
| Immigrants | Uzbekistan | 88.3 /100 | #144 | Excellent 20.3% |
| Austrians | 85.8 /100 | #145 | Excellent 20.4% |
| Venezuelans | 85.5 /100 | #146 | Excellent 20.4% |
| South Africans | 85.3 /100 | #147 | Excellent 20.4% |
| Luxembourgers | 84.9 /100 | #148 | Excellent 20.4% |
| Portuguese | 81.5 /100 | #149 | Excellent 20.5% |
| Immigrants | Denmark | 80.5 /100 | #150 | Excellent 20.5% |
| Puget Sound Salish | 79.6 /100 | #151 | Good 20.6% |
| Immigrants | Uruguay | 77.7 /100 | #152 | Good 20.6% |
| Swedes | 77.1 /100 | #153 | Good 20.6% |
Demographics Similar to Nonimmigrants by Single Female Poverty
In terms of single female poverty, the demographic groups most similar to Nonimmigrants are Alaskan Athabascan (23.6%, a difference of 0.040%), Pennsylvania German (23.6%, a difference of 0.080%), Immigrants from the Azores (23.5%, a difference of 0.23%), Immigrants from Latin America (23.7%, a difference of 0.53%), and Mexican American Indian (23.4%, a difference of 1.0%).
| Demographics | Rating | Rank | Single Female Poverty |
| Sub-Saharan Africans | 0.1 /100 | #271 | Tragic 23.2% |
| Immigrants | Senegal | 0.1 /100 | #272 | Tragic 23.2% |
| Alaska Natives | 0.1 /100 | #273 | Tragic 23.3% |
| Marshallese | 0.1 /100 | #274 | Tragic 23.3% |
| Mexican American Indians | 0.1 /100 | #275 | Tragic 23.4% |
| Immigrants | Azores | 0.0 /100 | #276 | Tragic 23.5% |
| Pennsylvania Germans | 0.0 /100 | #277 | Tragic 23.6% |
| Immigrants | Nonimmigrants | 0.0 /100 | #278 | Tragic 23.6% |
| Alaskan Athabascans | 0.0 /100 | #279 | Tragic 23.6% |
| Immigrants | Latin America | 0.0 /100 | #280 | Tragic 23.7% |
| Immigrants | Zaire | 0.0 /100 | #281 | Tragic 23.8% |
| Guatemalans | 0.0 /100 | #282 | Tragic 23.8% |
| German Russians | 0.0 /100 | #283 | Tragic 23.9% |
| Immigrants | Dominica | 0.0 /100 | #284 | Tragic 23.9% |
| Immigrants | Guatemala | 0.0 /100 | #285 | Tragic 24.1% |