Zimbabwean vs Immigrants from Central America Single Female Poverty
COMPARE
Zimbabwean
Immigrants from Central America
Single Female Poverty
Single Female Poverty Comparison
Zimbabweans
Immigrants from Central America
19.5%
SINGLE FEMALE POVERTY
99.0/ 100
METRIC RATING
87th/ 347
METRIC RANK
24.8%
SINGLE FEMALE POVERTY
0.0/ 100
METRIC RATING
297th/ 347
METRIC RANK
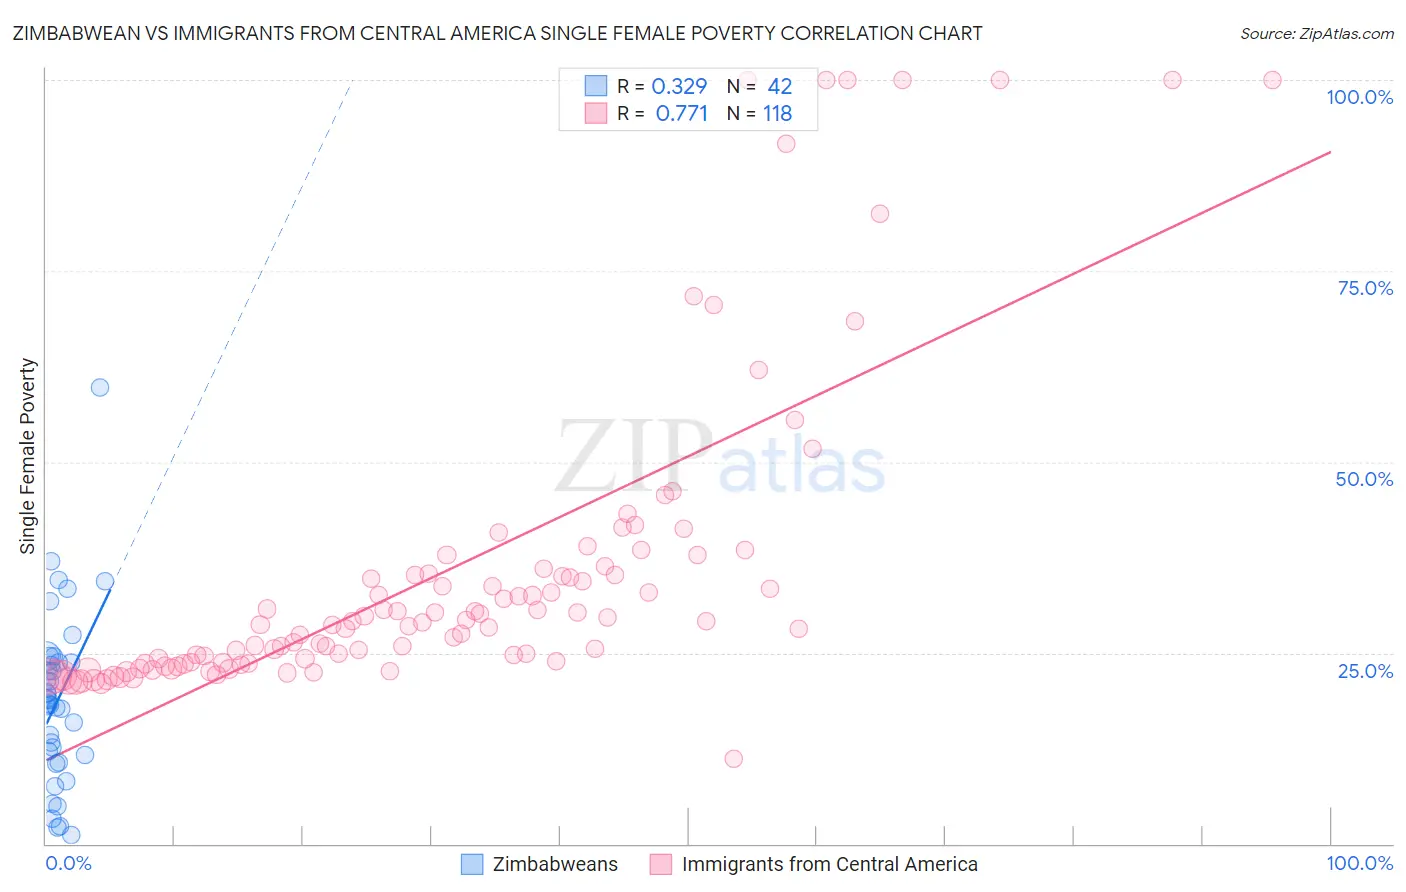
Zimbabwean vs Immigrants from Central America Single Female Poverty Correlation Chart
The statistical analysis conducted on geographies consisting of 69,078,290 people shows a mild positive correlation between the proportion of Zimbabweans and poverty level among single females in the United States with a correlation coefficient (R) of 0.329 and weighted average of 19.5%. Similarly, the statistical analysis conducted on geographies consisting of 523,015,170 people shows a strong positive correlation between the proportion of Immigrants from Central America and poverty level among single females in the United States with a correlation coefficient (R) of 0.771 and weighted average of 24.8%, a difference of 27.2%.
Single Female Poverty Correlation Summary
| Measurement | Zimbabwean | Immigrants from Central America |
| Minimum | 1.1% | 11.1% |
| Maximum | 59.7% | 100.0% |
| Range | 58.6% | 88.9% |
| Mean | 18.9% | 35.5% |
| Median | 18.6% | 28.8% |
| Interquartile 25% (IQ1) | 11.6% | 23.6% |
| Interquartile 75% (IQ3) | 23.8% | 35.4% |
| Interquartile Range (IQR) | 12.2% | 11.8% |
| Standard Deviation (Sample) | 11.3% | 20.4% |
| Standard Deviation (Population) | 11.1% | 20.3% |
Similar Demographics by Single Female Poverty
Demographics Similar to Zimbabweans by Single Female Poverty
In terms of single female poverty, the demographic groups most similar to Zimbabweans are Afghan (19.5%, a difference of 0.020%), Immigrants from Ukraine (19.5%, a difference of 0.030%), Immigrants from Lebanon (19.6%, a difference of 0.20%), Soviet Union (19.6%, a difference of 0.27%), and Italian (19.6%, a difference of 0.31%).
| Demographics | Rating | Rank | Single Female Poverty |
| Immigrants | Australia | 99.3 /100 | #80 | Exceptional 19.4% |
| Immigrants | Scotland | 99.2 /100 | #81 | Exceptional 19.4% |
| Immigrants | Malaysia | 99.2 /100 | #82 | Exceptional 19.4% |
| Taiwanese | 99.2 /100 | #83 | Exceptional 19.4% |
| Immigrants | Sweden | 99.2 /100 | #84 | Exceptional 19.4% |
| Immigrants | Albania | 99.2 /100 | #85 | Exceptional 19.4% |
| Greeks | 99.2 /100 | #86 | Exceptional 19.4% |
| Zimbabweans | 99.0 /100 | #87 | Exceptional 19.5% |
| Afghans | 99.0 /100 | #88 | Exceptional 19.5% |
| Immigrants | Ukraine | 99.0 /100 | #89 | Exceptional 19.5% |
| Immigrants | Lebanon | 98.8 /100 | #90 | Exceptional 19.6% |
| Soviet Union | 98.8 /100 | #91 | Exceptional 19.6% |
| Italians | 98.8 /100 | #92 | Exceptional 19.6% |
| Immigrants | Austria | 98.8 /100 | #93 | Exceptional 19.6% |
| Romanians | 98.6 /100 | #94 | Exceptional 19.6% |
Demographics Similar to Immigrants from Central America by Single Female Poverty
In terms of single female poverty, the demographic groups most similar to Immigrants from Central America are Yaqui (24.9%, a difference of 0.19%), African (24.8%, a difference of 0.28%), Hispanic or Latino (24.6%, a difference of 0.76%), Mexican (25.0%, a difference of 0.86%), and Blackfeet (25.1%, a difference of 0.94%).
| Demographics | Rating | Rank | Single Female Poverty |
| Indonesians | 0.0 /100 | #290 | Tragic 24.3% |
| Osage | 0.0 /100 | #291 | Tragic 24.4% |
| Alsatians | 0.0 /100 | #292 | Tragic 24.5% |
| Americans | 0.0 /100 | #293 | Tragic 24.5% |
| French American Indians | 0.0 /100 | #294 | Tragic 24.6% |
| Hispanics or Latinos | 0.0 /100 | #295 | Tragic 24.6% |
| Africans | 0.0 /100 | #296 | Tragic 24.8% |
| Immigrants | Central America | 0.0 /100 | #297 | Tragic 24.8% |
| Yaqui | 0.0 /100 | #298 | Tragic 24.9% |
| Mexicans | 0.0 /100 | #299 | Tragic 25.0% |
| Blackfeet | 0.0 /100 | #300 | Tragic 25.1% |
| Hondurans | 0.0 /100 | #301 | Tragic 25.1% |
| Shoshone | 0.0 /100 | #302 | Tragic 25.1% |
| Somalis | 0.0 /100 | #303 | Tragic 25.2% |
| Immigrants | Congo | 0.0 /100 | #304 | Tragic 25.3% |