Scottish vs Nonimmigrants Single Female Poverty
COMPARE
Scottish
Nonimmigrants
Single Female Poverty
Single Female Poverty Comparison
Scottish
Nonimmigrants
21.8%
SINGLE FEMALE POVERTY
7.3/ 100
METRIC RATING
223rd/ 347
METRIC RANK
23.6%
SINGLE FEMALE POVERTY
0.0/ 100
METRIC RATING
278th/ 347
METRIC RANK
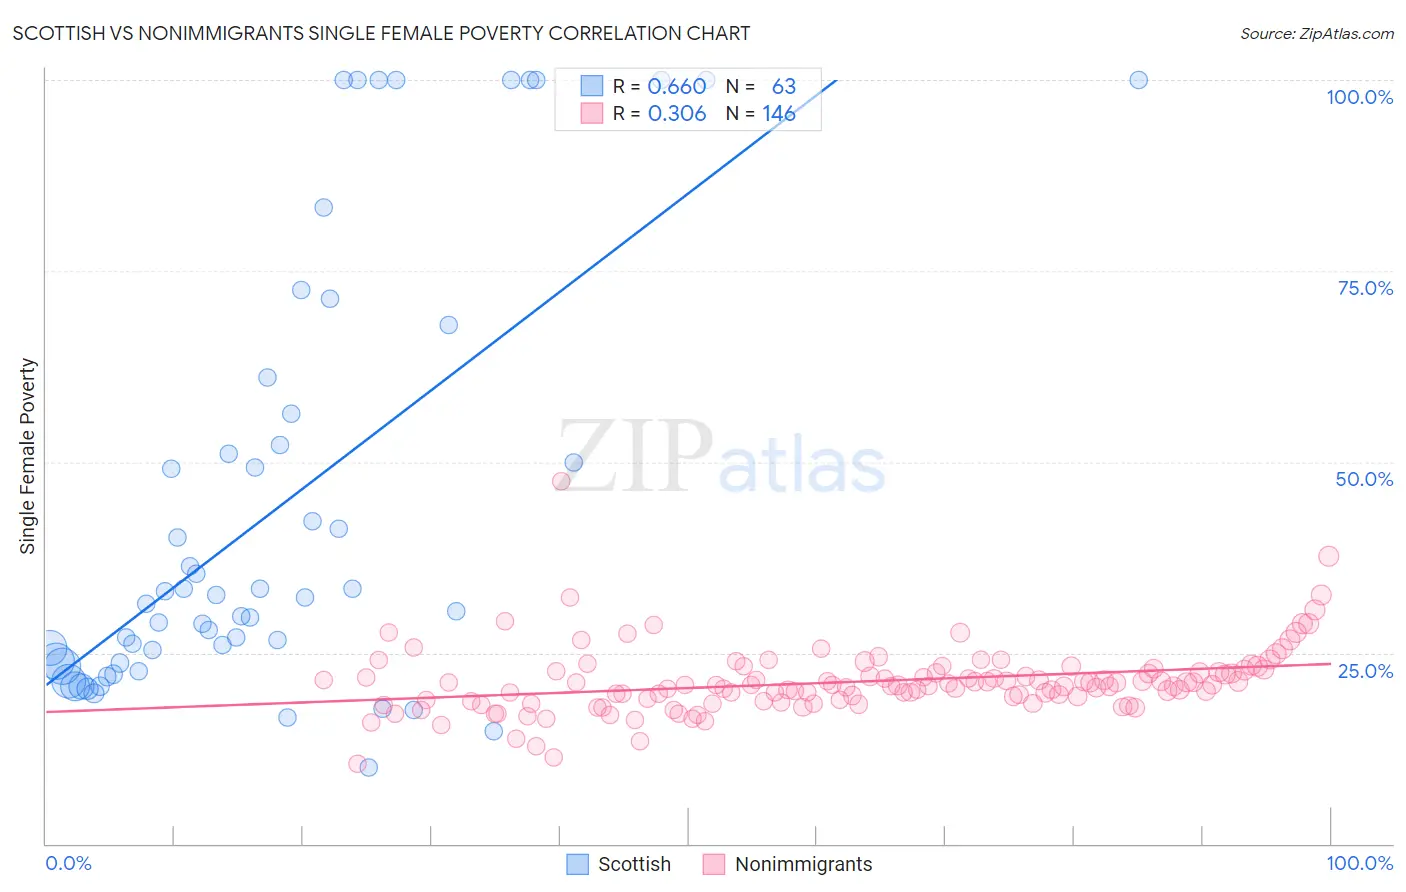
Scottish vs Nonimmigrants Single Female Poverty Correlation Chart
The statistical analysis conducted on geographies consisting of 546,834,351 people shows a significant positive correlation between the proportion of Scottish and poverty level among single females in the United States with a correlation coefficient (R) of 0.660 and weighted average of 21.8%. Similarly, the statistical analysis conducted on geographies consisting of 561,693,652 people shows a mild positive correlation between the proportion of Nonimmigrants and poverty level among single females in the United States with a correlation coefficient (R) of 0.306 and weighted average of 23.6%, a difference of 8.0%.
Single Female Poverty Correlation Summary
| Measurement | Scottish | Nonimmigrants |
| Minimum | 10.0% | 10.5% |
| Maximum | 100.0% | 47.5% |
| Range | 90.0% | 36.9% |
| Mean | 44.2% | 21.2% |
| Median | 32.2% | 20.7% |
| Interquartile 25% (IQ1) | 23.7% | 18.9% |
| Interquartile 75% (IQ3) | 56.2% | 22.6% |
| Interquartile Range (IQR) | 32.6% | 3.8% |
| Standard Deviation (Sample) | 28.5% | 4.4% |
| Standard Deviation (Population) | 28.3% | 4.4% |
Similar Demographics by Single Female Poverty
Demographics Similar to Scottish by Single Female Poverty
In terms of single female poverty, the demographic groups most similar to Scottish are Barbadian (21.8%, a difference of 0.020%), Immigrants from Eritrea (21.8%, a difference of 0.14%), Immigrants from Grenada (21.8%, a difference of 0.15%), English (21.9%, a difference of 0.20%), and German (21.8%, a difference of 0.21%).
| Demographics | Rating | Rank | Single Female Poverty |
| Immigrants | Barbados | 12.2 /100 | #216 | Poor 21.7% |
| Immigrants | St. Vincent and the Grenadines | 11.7 /100 | #217 | Poor 21.7% |
| Nepalese | 9.7 /100 | #218 | Tragic 21.7% |
| Panamanians | 9.4 /100 | #219 | Tragic 21.7% |
| Germans | 8.3 /100 | #220 | Tragic 21.8% |
| Immigrants | Grenada | 8.0 /100 | #221 | Tragic 21.8% |
| Immigrants | Eritrea | 7.9 /100 | #222 | Tragic 21.8% |
| Scottish | 7.3 /100 | #223 | Tragic 21.8% |
| Barbadians | 7.2 /100 | #224 | Tragic 21.8% |
| English | 6.4 /100 | #225 | Tragic 21.9% |
| Immigrants | Portugal | 5.8 /100 | #226 | Tragic 21.9% |
| Immigrants | Ghana | 5.8 /100 | #227 | Tragic 21.9% |
| Salvadorans | 5.5 /100 | #228 | Tragic 21.9% |
| Tlingit-Haida | 5.4 /100 | #229 | Tragic 21.9% |
| Immigrants | Western Africa | 5.3 /100 | #230 | Tragic 22.0% |
Demographics Similar to Nonimmigrants by Single Female Poverty
In terms of single female poverty, the demographic groups most similar to Nonimmigrants are Alaskan Athabascan (23.6%, a difference of 0.040%), Pennsylvania German (23.6%, a difference of 0.080%), Immigrants from the Azores (23.5%, a difference of 0.23%), Immigrants from Latin America (23.7%, a difference of 0.53%), and Mexican American Indian (23.4%, a difference of 1.0%).
| Demographics | Rating | Rank | Single Female Poverty |
| Sub-Saharan Africans | 0.1 /100 | #271 | Tragic 23.2% |
| Immigrants | Senegal | 0.1 /100 | #272 | Tragic 23.2% |
| Alaska Natives | 0.1 /100 | #273 | Tragic 23.3% |
| Marshallese | 0.1 /100 | #274 | Tragic 23.3% |
| Mexican American Indians | 0.1 /100 | #275 | Tragic 23.4% |
| Immigrants | Azores | 0.0 /100 | #276 | Tragic 23.5% |
| Pennsylvania Germans | 0.0 /100 | #277 | Tragic 23.6% |
| Immigrants | Nonimmigrants | 0.0 /100 | #278 | Tragic 23.6% |
| Alaskan Athabascans | 0.0 /100 | #279 | Tragic 23.6% |
| Immigrants | Latin America | 0.0 /100 | #280 | Tragic 23.7% |
| Immigrants | Zaire | 0.0 /100 | #281 | Tragic 23.8% |
| Guatemalans | 0.0 /100 | #282 | Tragic 23.8% |
| German Russians | 0.0 /100 | #283 | Tragic 23.9% |
| Immigrants | Dominica | 0.0 /100 | #284 | Tragic 23.9% |
| Immigrants | Guatemala | 0.0 /100 | #285 | Tragic 24.1% |