Pakistani vs Nonimmigrants Single Female Poverty
COMPARE
Pakistani
Nonimmigrants
Single Female Poverty
Single Female Poverty Comparison
Pakistanis
Nonimmigrants
20.2%
SINGLE FEMALE POVERTY
92.1/ 100
METRIC RATING
131st/ 347
METRIC RANK
23.6%
SINGLE FEMALE POVERTY
0.0/ 100
METRIC RATING
278th/ 347
METRIC RANK
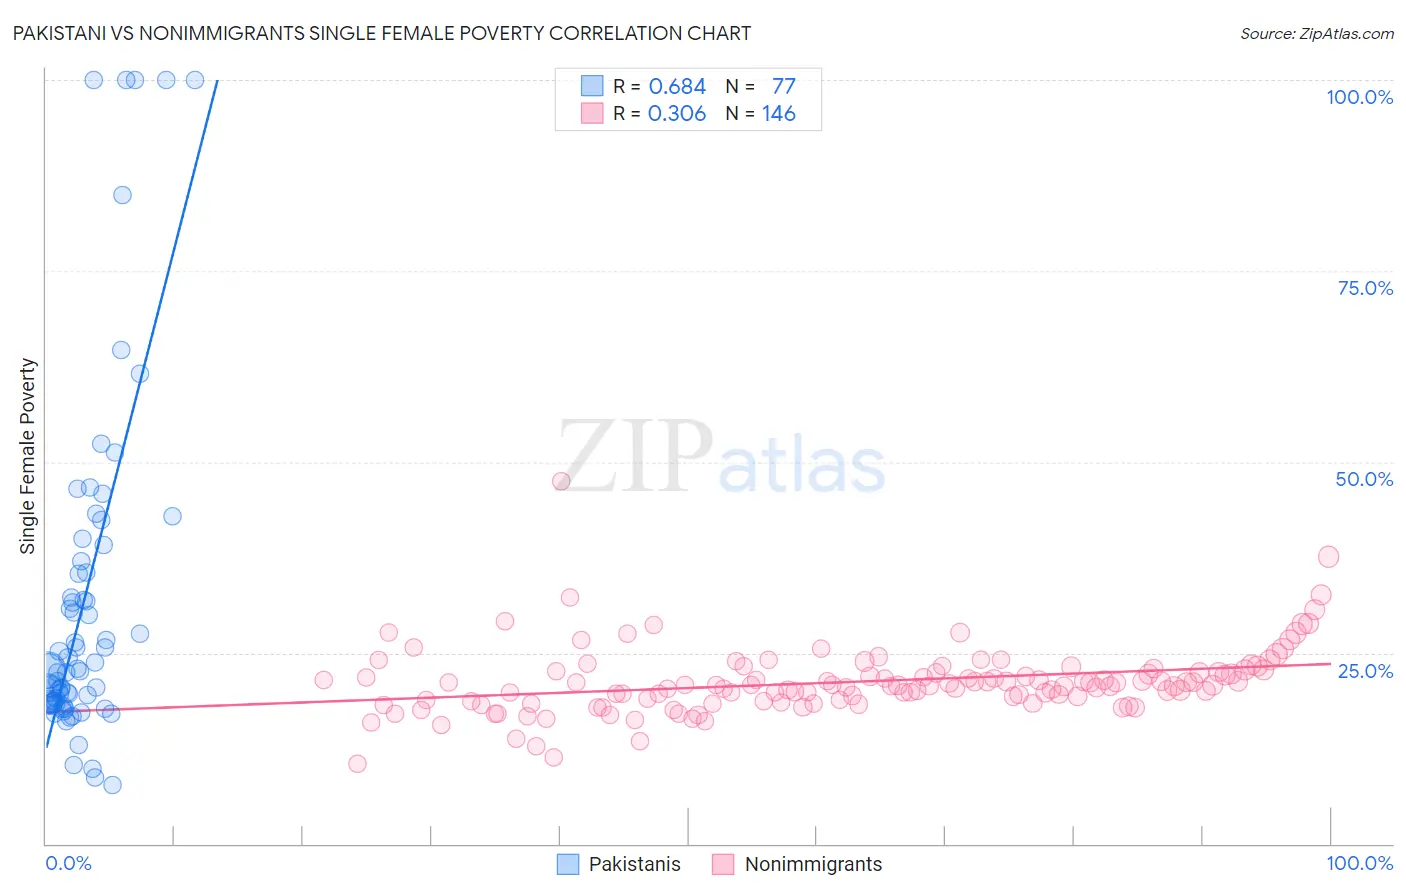
Pakistani vs Nonimmigrants Single Female Poverty Correlation Chart
The statistical analysis conducted on geographies consisting of 331,803,446 people shows a significant positive correlation between the proportion of Pakistanis and poverty level among single females in the United States with a correlation coefficient (R) of 0.684 and weighted average of 20.2%. Similarly, the statistical analysis conducted on geographies consisting of 561,693,652 people shows a mild positive correlation between the proportion of Nonimmigrants and poverty level among single females in the United States with a correlation coefficient (R) of 0.306 and weighted average of 23.6%, a difference of 16.8%.
Single Female Poverty Correlation Summary
| Measurement | Pakistani | Nonimmigrants |
| Minimum | 7.7% | 10.5% |
| Maximum | 100.0% | 47.5% |
| Range | 92.3% | 36.9% |
| Mean | 31.6% | 21.2% |
| Median | 22.6% | 20.7% |
| Interquartile 25% (IQ1) | 18.4% | 18.9% |
| Interquartile 75% (IQ3) | 36.2% | 22.6% |
| Interquartile Range (IQR) | 17.8% | 3.8% |
| Standard Deviation (Sample) | 22.5% | 4.4% |
| Standard Deviation (Population) | 22.4% | 4.4% |
Similar Demographics by Single Female Poverty
Demographics Similar to Pakistanis by Single Female Poverty
In terms of single female poverty, the demographic groups most similar to Pakistanis are Uruguayan (20.2%, a difference of 0.0%), Immigrants from England (20.2%, a difference of 0.030%), Immigrants from Hungary (20.2%, a difference of 0.050%), Immigrants from Morocco (20.2%, a difference of 0.080%), and Immigrants from Venezuela (20.2%, a difference of 0.12%).
| Demographics | Rating | Rank | Single Female Poverty |
| Immigrants | Chile | 94.3 /100 | #124 | Exceptional 20.1% |
| Immigrants | South Africa | 93.9 /100 | #125 | Exceptional 20.1% |
| Serbians | 93.3 /100 | #126 | Exceptional 20.1% |
| Mongolians | 93.2 /100 | #127 | Exceptional 20.2% |
| Immigrants | Spain | 92.7 /100 | #128 | Exceptional 20.2% |
| Immigrants | Morocco | 92.4 /100 | #129 | Exceptional 20.2% |
| Immigrants | Hungary | 92.3 /100 | #130 | Exceptional 20.2% |
| Pakistanis | 92.1 /100 | #131 | Exceptional 20.2% |
| Uruguayans | 92.1 /100 | #132 | Exceptional 20.2% |
| Immigrants | England | 91.9 /100 | #133 | Exceptional 20.2% |
| Immigrants | Venezuela | 91.5 /100 | #134 | Exceptional 20.2% |
| Immigrants | Iraq | 91.2 /100 | #135 | Exceptional 20.2% |
| Immigrants | Canada | 91.2 /100 | #136 | Exceptional 20.2% |
| Immigrants | Nepal | 90.6 /100 | #137 | Exceptional 20.3% |
| Slovenes | 90.5 /100 | #138 | Exceptional 20.3% |
Demographics Similar to Nonimmigrants by Single Female Poverty
In terms of single female poverty, the demographic groups most similar to Nonimmigrants are Alaskan Athabascan (23.6%, a difference of 0.040%), Pennsylvania German (23.6%, a difference of 0.080%), Immigrants from the Azores (23.5%, a difference of 0.23%), Immigrants from Latin America (23.7%, a difference of 0.53%), and Mexican American Indian (23.4%, a difference of 1.0%).
| Demographics | Rating | Rank | Single Female Poverty |
| Sub-Saharan Africans | 0.1 /100 | #271 | Tragic 23.2% |
| Immigrants | Senegal | 0.1 /100 | #272 | Tragic 23.2% |
| Alaska Natives | 0.1 /100 | #273 | Tragic 23.3% |
| Marshallese | 0.1 /100 | #274 | Tragic 23.3% |
| Mexican American Indians | 0.1 /100 | #275 | Tragic 23.4% |
| Immigrants | Azores | 0.0 /100 | #276 | Tragic 23.5% |
| Pennsylvania Germans | 0.0 /100 | #277 | Tragic 23.6% |
| Immigrants | Nonimmigrants | 0.0 /100 | #278 | Tragic 23.6% |
| Alaskan Athabascans | 0.0 /100 | #279 | Tragic 23.6% |
| Immigrants | Latin America | 0.0 /100 | #280 | Tragic 23.7% |
| Immigrants | Zaire | 0.0 /100 | #281 | Tragic 23.8% |
| Guatemalans | 0.0 /100 | #282 | Tragic 23.8% |
| German Russians | 0.0 /100 | #283 | Tragic 23.9% |
| Immigrants | Dominica | 0.0 /100 | #284 | Tragic 23.9% |
| Immigrants | Guatemala | 0.0 /100 | #285 | Tragic 24.1% |