Zimbabwean vs Lumbee Poverty
COMPARE
Zimbabwean
Lumbee
Poverty
Poverty Comparison
Zimbabweans
Lumbee
11.3%
POVERTY
97.3/ 100
METRIC RATING
71st/ 347
METRIC RANK
21.9%
POVERTY
0.0/ 100
METRIC RATING
344th/ 347
METRIC RANK
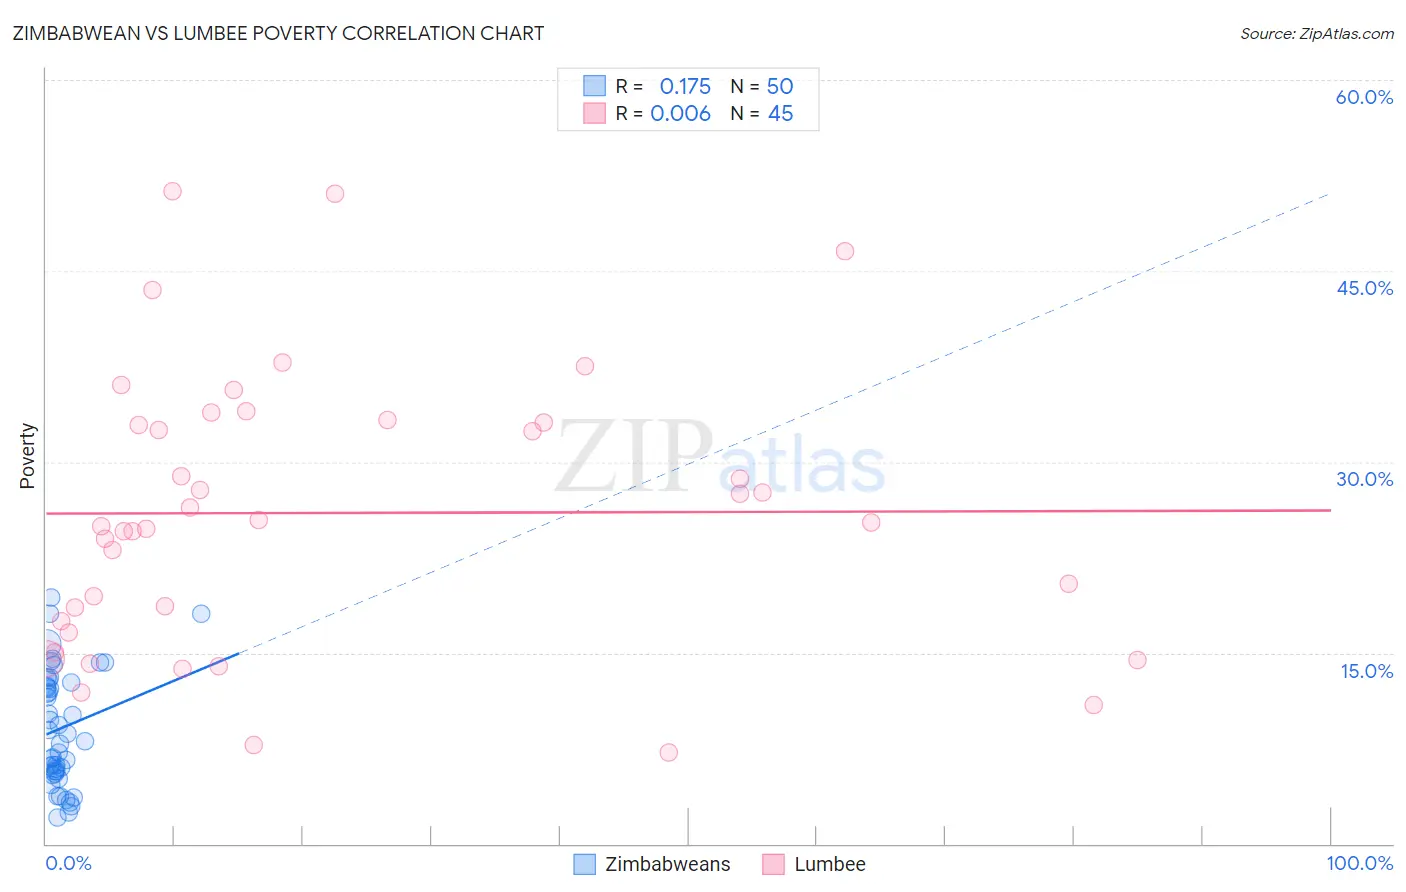
Zimbabwean vs Lumbee Poverty Correlation Chart
The statistical analysis conducted on geographies consisting of 69,186,100 people shows a poor positive correlation between the proportion of Zimbabweans and poverty level in the United States with a correlation coefficient (R) of 0.175 and weighted average of 11.3%. Similarly, the statistical analysis conducted on geographies consisting of 92,257,257 people shows no correlation between the proportion of Lumbee and poverty level in the United States with a correlation coefficient (R) of 0.006 and weighted average of 21.9%, a difference of 94.7%.
Poverty Correlation Summary
| Measurement | Zimbabwean | Lumbee |
| Minimum | 2.0% | 7.2% |
| Maximum | 19.3% | 51.2% |
| Range | 17.3% | 44.0% |
| Mean | 9.1% | 26.0% |
| Median | 8.4% | 25.2% |
| Interquartile 25% (IQ1) | 5.7% | 17.0% |
| Interquartile 75% (IQ3) | 12.6% | 33.2% |
| Interquartile Range (IQR) | 6.9% | 16.2% |
| Standard Deviation (Sample) | 4.5% | 10.8% |
| Standard Deviation (Population) | 4.5% | 10.7% |
Similar Demographics by Poverty
Demographics Similar to Zimbabweans by Poverty
In terms of poverty, the demographic groups most similar to Zimbabweans are Immigrants from Canada (11.3%, a difference of 0.020%), European (11.3%, a difference of 0.020%), Immigrants from Belgium (11.3%, a difference of 0.020%), Carpatho Rusyn (11.3%, a difference of 0.070%), and Serbian (11.2%, a difference of 0.11%).
| Demographics | Rating | Rank | Poverty |
| Swiss | 97.7 /100 | #64 | Exceptional 11.2% |
| Immigrants | Asia | 97.5 /100 | #65 | Exceptional 11.2% |
| Immigrants | Netherlands | 97.5 /100 | #66 | Exceptional 11.2% |
| Immigrants | Australia | 97.4 /100 | #67 | Exceptional 11.2% |
| Slovaks | 97.4 /100 | #68 | Exceptional 11.2% |
| Serbians | 97.4 /100 | #69 | Exceptional 11.2% |
| Immigrants | Canada | 97.3 /100 | #70 | Exceptional 11.3% |
| Zimbabweans | 97.3 /100 | #71 | Exceptional 11.3% |
| Europeans | 97.2 /100 | #72 | Exceptional 11.3% |
| Immigrants | Belgium | 97.2 /100 | #73 | Exceptional 11.3% |
| Carpatho Rusyns | 97.2 /100 | #74 | Exceptional 11.3% |
| Immigrants | Eastern Europe | 97.0 /100 | #75 | Exceptional 11.3% |
| Immigrants | North America | 96.8 /100 | #76 | Exceptional 11.3% |
| Immigrants | Eastern Asia | 96.7 /100 | #77 | Exceptional 11.3% |
| Dutch | 96.7 /100 | #78 | Exceptional 11.3% |
Demographics Similar to Lumbee by Poverty
In terms of poverty, the demographic groups most similar to Lumbee are Pima (21.9%, a difference of 0.26%), Immigrants from Yemen (21.5%, a difference of 1.9%), Hopi (20.8%, a difference of 5.1%), Yup'ik (20.8%, a difference of 5.3%), and Navajo (23.1%, a difference of 5.4%).
| Demographics | Rating | Rank | Poverty |
| Houma | 0.0 /100 | #333 | Tragic 18.4% |
| Apache | 0.0 /100 | #334 | Tragic 18.4% |
| Cheyenne | 0.0 /100 | #335 | Tragic 18.9% |
| Pueblo | 0.0 /100 | #336 | Tragic 19.4% |
| Sioux | 0.0 /100 | #337 | Tragic 19.8% |
| Yuman | 0.0 /100 | #338 | Tragic 20.2% |
| Crow | 0.0 /100 | #339 | Tragic 20.7% |
| Yup'ik | 0.0 /100 | #340 | Tragic 20.8% |
| Hopi | 0.0 /100 | #341 | Tragic 20.8% |
| Immigrants | Yemen | 0.0 /100 | #342 | Tragic 21.5% |
| Pima | 0.0 /100 | #343 | Tragic 21.9% |
| Lumbee | 0.0 /100 | #344 | Tragic 21.9% |
| Navajo | 0.0 /100 | #345 | Tragic 23.1% |
| Puerto Ricans | 0.0 /100 | #346 | Tragic 23.7% |
| Tohono O'odham | 0.0 /100 | #347 | Tragic 24.4% |