Albanian vs Lumbee Poverty
COMPARE
Albanian
Lumbee
Poverty
Poverty Comparison
Albanians
Lumbee
11.7%
POVERTY
90.3/ 100
METRIC RATING
115th/ 347
METRIC RANK
21.9%
POVERTY
0.0/ 100
METRIC RATING
344th/ 347
METRIC RANK
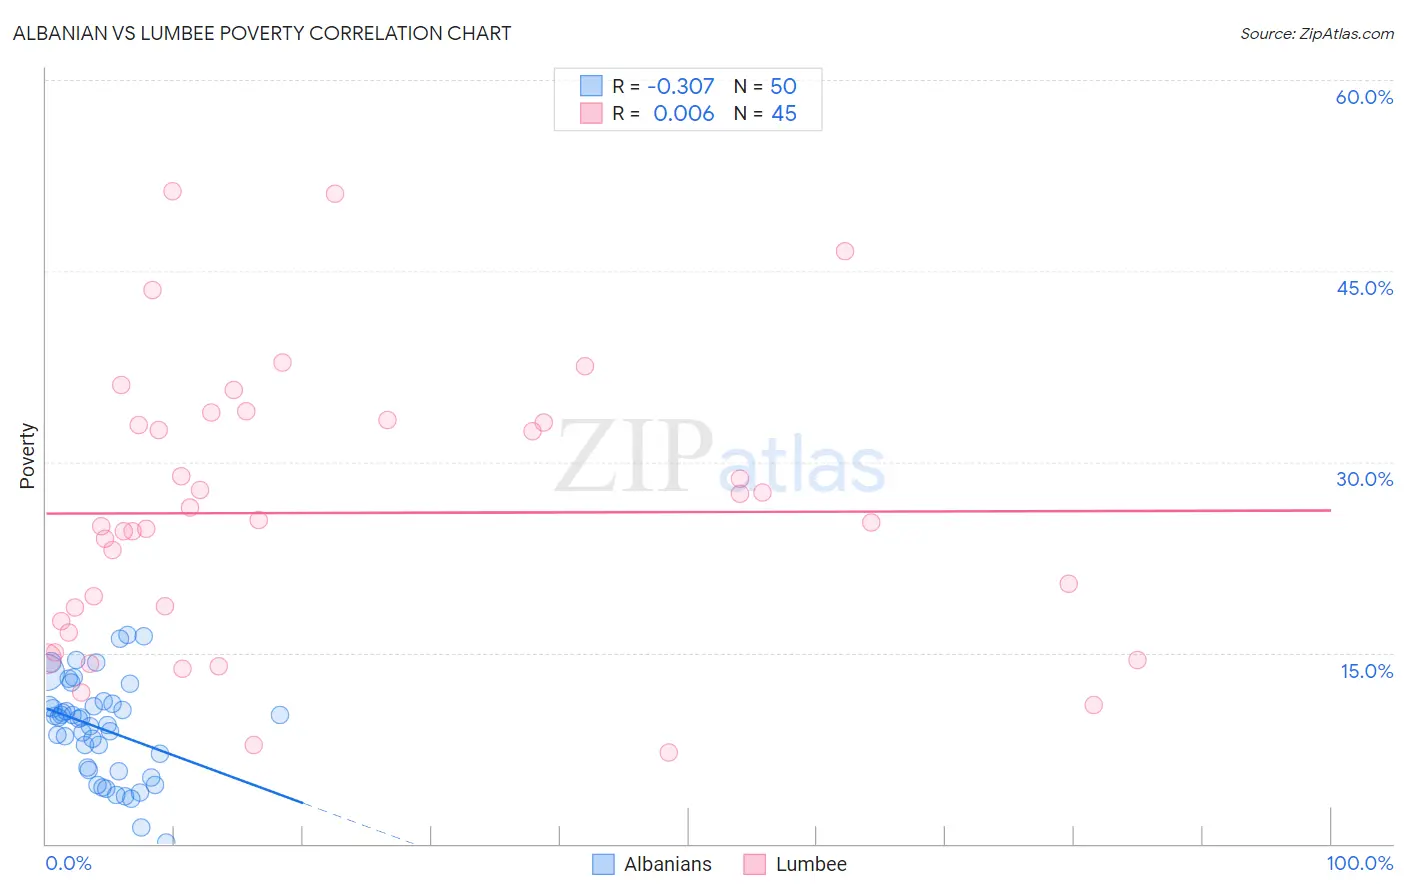
Albanian vs Lumbee Poverty Correlation Chart
The statistical analysis conducted on geographies consisting of 193,180,317 people shows a mild negative correlation between the proportion of Albanians and poverty level in the United States with a correlation coefficient (R) of -0.307 and weighted average of 11.7%. Similarly, the statistical analysis conducted on geographies consisting of 92,257,257 people shows no correlation between the proportion of Lumbee and poverty level in the United States with a correlation coefficient (R) of 0.006 and weighted average of 21.9%, a difference of 88.0%.
Poverty Correlation Summary
| Measurement | Albanian | Lumbee |
| Minimum | 0.071% | 7.2% |
| Maximum | 16.4% | 51.2% |
| Range | 16.3% | 44.0% |
| Mean | 9.1% | 26.0% |
| Median | 9.9% | 25.2% |
| Interquartile 25% (IQ1) | 5.8% | 17.0% |
| Interquartile 75% (IQ3) | 11.0% | 33.2% |
| Interquartile Range (IQR) | 5.2% | 16.2% |
| Standard Deviation (Sample) | 3.9% | 10.8% |
| Standard Deviation (Population) | 3.8% | 10.7% |
Similar Demographics by Poverty
Demographics Similar to Albanians by Poverty
In terms of poverty, the demographic groups most similar to Albanians are Immigrants from China (11.6%, a difference of 0.14%), Immigrants from Southern Europe (11.6%, a difference of 0.16%), Immigrants from Belarus (11.6%, a difference of 0.16%), Immigrants from Russia (11.7%, a difference of 0.17%), and French Canadian (11.6%, a difference of 0.23%).
| Demographics | Rating | Rank | Poverty |
| Canadians | 91.7 /100 | #108 | Exceptional 11.6% |
| Immigrants | Turkey | 91.7 /100 | #109 | Exceptional 11.6% |
| Welsh | 91.6 /100 | #110 | Exceptional 11.6% |
| French Canadians | 91.0 /100 | #111 | Exceptional 11.6% |
| Immigrants | Southern Europe | 90.8 /100 | #112 | Exceptional 11.6% |
| Immigrants | Belarus | 90.8 /100 | #113 | Exceptional 11.6% |
| Immigrants | China | 90.7 /100 | #114 | Exceptional 11.6% |
| Albanians | 90.3 /100 | #115 | Exceptional 11.7% |
| Immigrants | Russia | 89.7 /100 | #116 | Excellent 11.7% |
| Sri Lankans | 89.4 /100 | #117 | Excellent 11.7% |
| Argentineans | 89.1 /100 | #118 | Excellent 11.7% |
| Tlingit-Haida | 89.0 /100 | #119 | Excellent 11.7% |
| Immigrants | South Eastern Asia | 88.9 /100 | #120 | Excellent 11.7% |
| New Zealanders | 88.7 /100 | #121 | Excellent 11.7% |
| Puget Sound Salish | 88.7 /100 | #122 | Excellent 11.7% |
Demographics Similar to Lumbee by Poverty
In terms of poverty, the demographic groups most similar to Lumbee are Pima (21.9%, a difference of 0.26%), Immigrants from Yemen (21.5%, a difference of 1.9%), Hopi (20.8%, a difference of 5.1%), Yup'ik (20.8%, a difference of 5.3%), and Navajo (23.1%, a difference of 5.4%).
| Demographics | Rating | Rank | Poverty |
| Houma | 0.0 /100 | #333 | Tragic 18.4% |
| Apache | 0.0 /100 | #334 | Tragic 18.4% |
| Cheyenne | 0.0 /100 | #335 | Tragic 18.9% |
| Pueblo | 0.0 /100 | #336 | Tragic 19.4% |
| Sioux | 0.0 /100 | #337 | Tragic 19.8% |
| Yuman | 0.0 /100 | #338 | Tragic 20.2% |
| Crow | 0.0 /100 | #339 | Tragic 20.7% |
| Yup'ik | 0.0 /100 | #340 | Tragic 20.8% |
| Hopi | 0.0 /100 | #341 | Tragic 20.8% |
| Immigrants | Yemen | 0.0 /100 | #342 | Tragic 21.5% |
| Pima | 0.0 /100 | #343 | Tragic 21.9% |
| Lumbee | 0.0 /100 | #344 | Tragic 21.9% |
| Navajo | 0.0 /100 | #345 | Tragic 23.1% |
| Puerto Ricans | 0.0 /100 | #346 | Tragic 23.7% |
| Tohono O'odham | 0.0 /100 | #347 | Tragic 24.4% |