Zimbabwean vs Immigrants from Haiti Poverty
COMPARE
Zimbabwean
Immigrants from Haiti
Poverty
Poverty Comparison
Zimbabweans
Immigrants from Haiti
11.3%
POVERTY
97.3/ 100
METRIC RATING
71st/ 347
METRIC RANK
15.0%
POVERTY
0.0/ 100
METRIC RATING
283rd/ 347
METRIC RANK
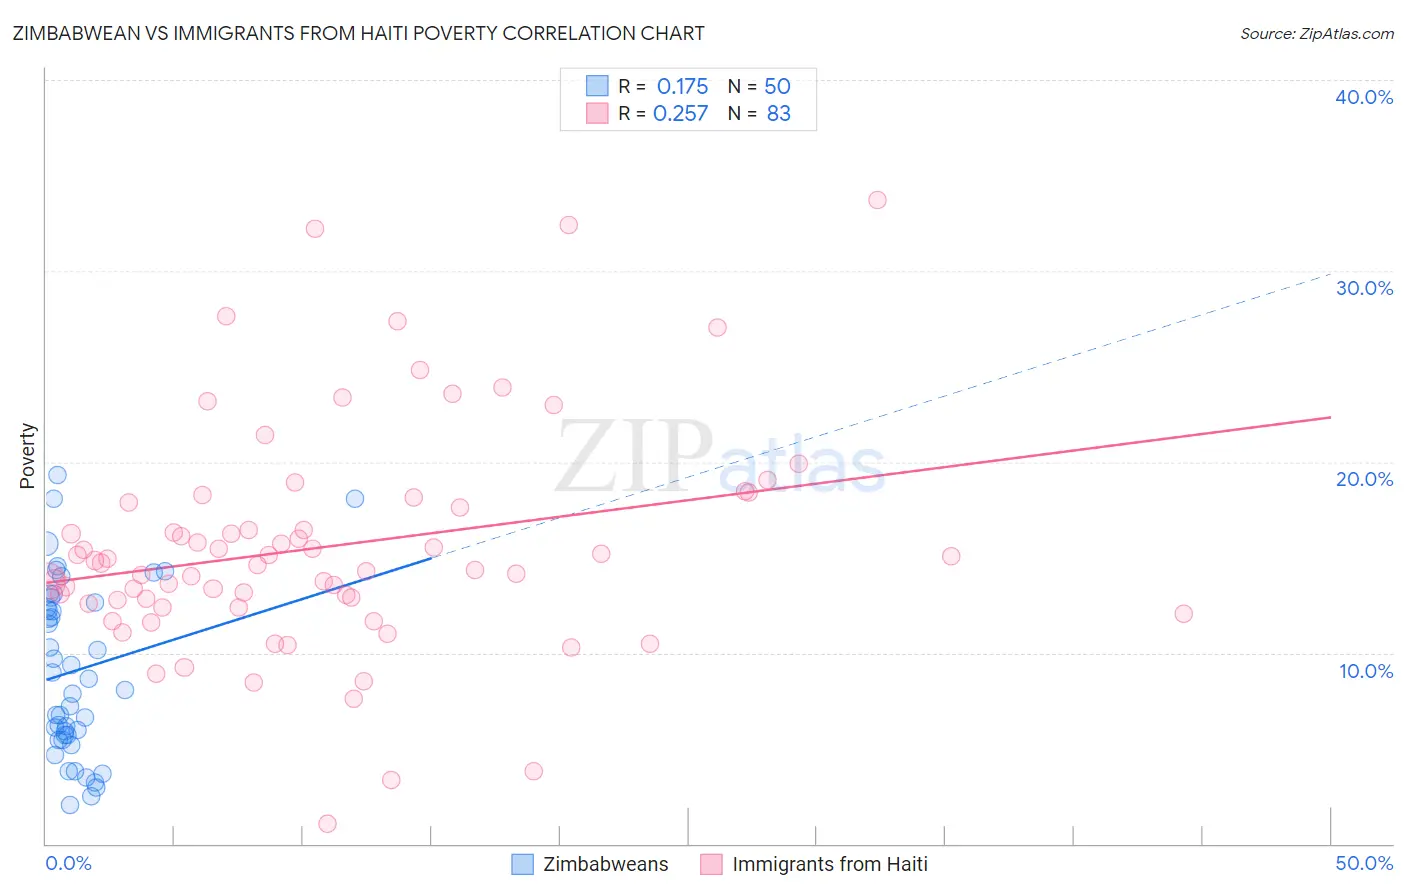
Zimbabwean vs Immigrants from Haiti Poverty Correlation Chart
The statistical analysis conducted on geographies consisting of 69,186,100 people shows a poor positive correlation between the proportion of Zimbabweans and poverty level in the United States with a correlation coefficient (R) of 0.175 and weighted average of 11.3%. Similarly, the statistical analysis conducted on geographies consisting of 225,178,584 people shows a weak positive correlation between the proportion of Immigrants from Haiti and poverty level in the United States with a correlation coefficient (R) of 0.257 and weighted average of 15.0%, a difference of 33.1%.
Poverty Correlation Summary
| Measurement | Zimbabwean | Immigrants from Haiti |
| Minimum | 2.0% | 1.1% |
| Maximum | 19.3% | 33.7% |
| Range | 17.3% | 32.7% |
| Mean | 9.1% | 15.6% |
| Median | 8.4% | 14.7% |
| Interquartile 25% (IQ1) | 5.7% | 12.6% |
| Interquartile 75% (IQ3) | 12.6% | 17.9% |
| Interquartile Range (IQR) | 6.9% | 5.3% |
| Standard Deviation (Sample) | 4.5% | 5.9% |
| Standard Deviation (Population) | 4.5% | 5.9% |
Similar Demographics by Poverty
Demographics Similar to Zimbabweans by Poverty
In terms of poverty, the demographic groups most similar to Zimbabweans are Immigrants from Canada (11.3%, a difference of 0.020%), European (11.3%, a difference of 0.020%), Immigrants from Belgium (11.3%, a difference of 0.020%), Carpatho Rusyn (11.3%, a difference of 0.070%), and Serbian (11.2%, a difference of 0.11%).
| Demographics | Rating | Rank | Poverty |
| Swiss | 97.7 /100 | #64 | Exceptional 11.2% |
| Immigrants | Asia | 97.5 /100 | #65 | Exceptional 11.2% |
| Immigrants | Netherlands | 97.5 /100 | #66 | Exceptional 11.2% |
| Immigrants | Australia | 97.4 /100 | #67 | Exceptional 11.2% |
| Slovaks | 97.4 /100 | #68 | Exceptional 11.2% |
| Serbians | 97.4 /100 | #69 | Exceptional 11.2% |
| Immigrants | Canada | 97.3 /100 | #70 | Exceptional 11.3% |
| Zimbabweans | 97.3 /100 | #71 | Exceptional 11.3% |
| Europeans | 97.2 /100 | #72 | Exceptional 11.3% |
| Immigrants | Belgium | 97.2 /100 | #73 | Exceptional 11.3% |
| Carpatho Rusyns | 97.2 /100 | #74 | Exceptional 11.3% |
| Immigrants | Eastern Europe | 97.0 /100 | #75 | Exceptional 11.3% |
| Immigrants | North America | 96.8 /100 | #76 | Exceptional 11.3% |
| Immigrants | Eastern Asia | 96.7 /100 | #77 | Exceptional 11.3% |
| Dutch | 96.7 /100 | #78 | Exceptional 11.3% |
Demographics Similar to Immigrants from Haiti by Poverty
In terms of poverty, the demographic groups most similar to Immigrants from Haiti are West Indian (15.0%, a difference of 0.10%), Comanche (15.0%, a difference of 0.12%), Vietnamese (15.0%, a difference of 0.16%), Immigrants from Latin America (15.0%, a difference of 0.42%), and Immigrants from Barbados (14.9%, a difference of 0.45%).
| Demographics | Rating | Rank | Poverty |
| Immigrants | Bahamas | 0.0 /100 | #276 | Tragic 14.8% |
| Bangladeshis | 0.0 /100 | #277 | Tragic 14.8% |
| Belizeans | 0.0 /100 | #278 | Tragic 14.8% |
| Immigrants | St. Vincent and the Grenadines | 0.0 /100 | #279 | Tragic 14.9% |
| Haitians | 0.0 /100 | #280 | Tragic 14.9% |
| Immigrants | Barbados | 0.0 /100 | #281 | Tragic 14.9% |
| Comanche | 0.0 /100 | #282 | Tragic 15.0% |
| Immigrants | Haiti | 0.0 /100 | #283 | Tragic 15.0% |
| West Indians | 0.0 /100 | #284 | Tragic 15.0% |
| Vietnamese | 0.0 /100 | #285 | Tragic 15.0% |
| Immigrants | Latin America | 0.0 /100 | #286 | Tragic 15.0% |
| Inupiat | 0.0 /100 | #287 | Tragic 15.1% |
| Yaqui | 0.0 /100 | #288 | Tragic 15.1% |
| Immigrants | Belize | 0.0 /100 | #289 | Tragic 15.1% |
| Mexicans | 0.0 /100 | #290 | Tragic 15.1% |