Zimbabwean vs Immigrants from Chile Poverty
COMPARE
Zimbabwean
Immigrants from Chile
Poverty
Poverty Comparison
Zimbabweans
Immigrants from Chile
11.3%
POVERTY
97.3/ 100
METRIC RATING
71st/ 347
METRIC RANK
12.2%
POVERTY
56.7/ 100
METRIC RATING
167th/ 347
METRIC RANK
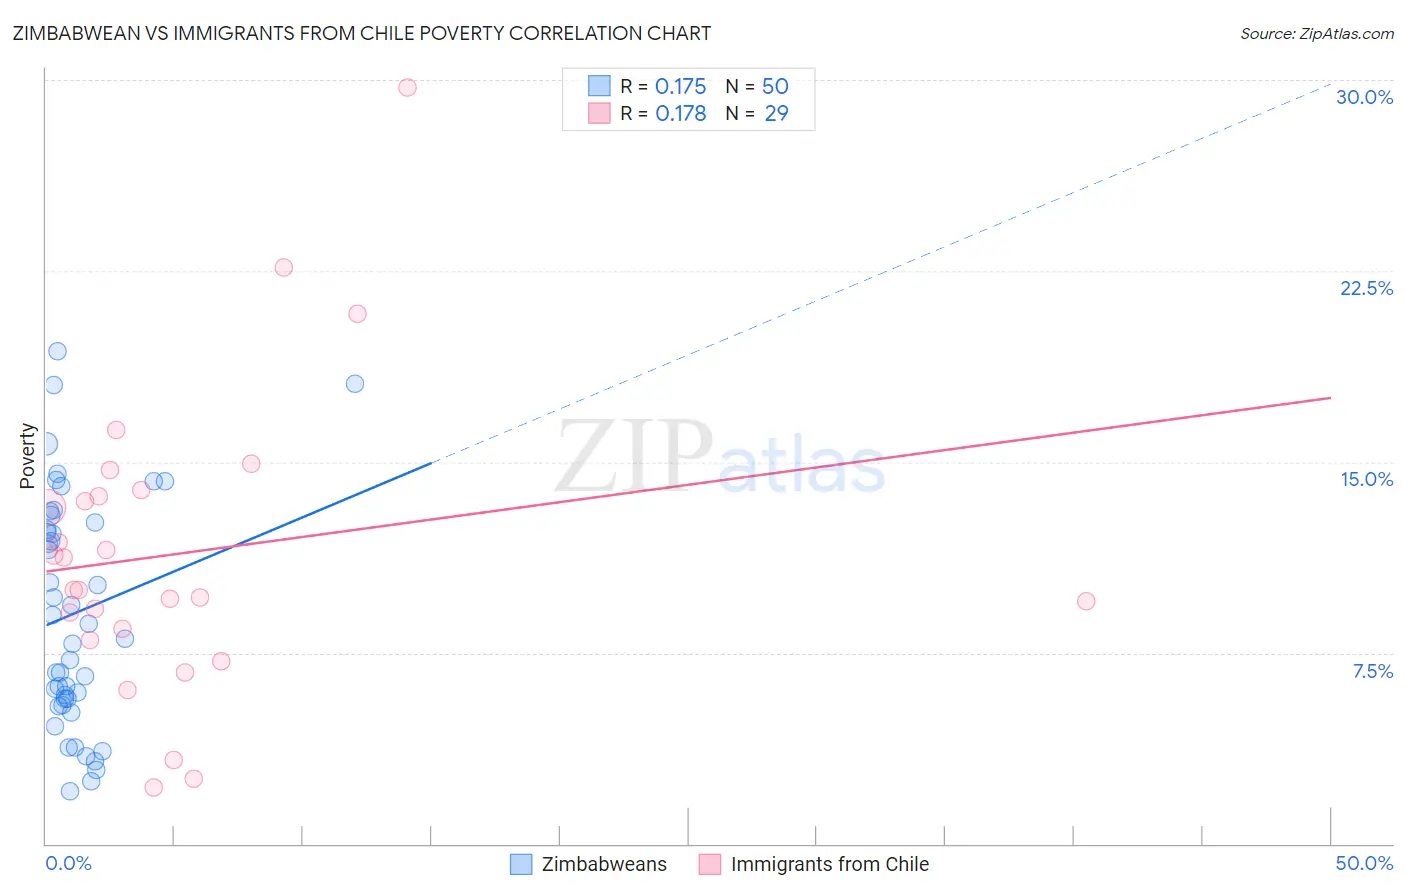
Zimbabwean vs Immigrants from Chile Poverty Correlation Chart
The statistical analysis conducted on geographies consisting of 69,186,100 people shows a poor positive correlation between the proportion of Zimbabweans and poverty level in the United States with a correlation coefficient (R) of 0.175 and weighted average of 11.3%. Similarly, the statistical analysis conducted on geographies consisting of 218,605,054 people shows a poor positive correlation between the proportion of Immigrants from Chile and poverty level in the United States with a correlation coefficient (R) of 0.178 and weighted average of 12.2%, a difference of 8.8%.
Poverty Correlation Summary
| Measurement | Zimbabwean | Immigrants from Chile |
| Minimum | 2.0% | 2.2% |
| Maximum | 19.3% | 29.7% |
| Range | 17.3% | 27.5% |
| Mean | 9.1% | 11.4% |
| Median | 8.4% | 10.0% |
| Interquartile 25% (IQ1) | 5.7% | 8.2% |
| Interquartile 75% (IQ3) | 12.6% | 13.8% |
| Interquartile Range (IQR) | 6.9% | 5.6% |
| Standard Deviation (Sample) | 4.5% | 5.8% |
| Standard Deviation (Population) | 4.5% | 5.7% |
Similar Demographics by Poverty
Demographics Similar to Zimbabweans by Poverty
In terms of poverty, the demographic groups most similar to Zimbabweans are Immigrants from Canada (11.3%, a difference of 0.020%), European (11.3%, a difference of 0.020%), Immigrants from Belgium (11.3%, a difference of 0.020%), Carpatho Rusyn (11.3%, a difference of 0.070%), and Serbian (11.2%, a difference of 0.11%).
| Demographics | Rating | Rank | Poverty |
| Swiss | 97.7 /100 | #64 | Exceptional 11.2% |
| Immigrants | Asia | 97.5 /100 | #65 | Exceptional 11.2% |
| Immigrants | Netherlands | 97.5 /100 | #66 | Exceptional 11.2% |
| Immigrants | Australia | 97.4 /100 | #67 | Exceptional 11.2% |
| Slovaks | 97.4 /100 | #68 | Exceptional 11.2% |
| Serbians | 97.4 /100 | #69 | Exceptional 11.2% |
| Immigrants | Canada | 97.3 /100 | #70 | Exceptional 11.3% |
| Zimbabweans | 97.3 /100 | #71 | Exceptional 11.3% |
| Europeans | 97.2 /100 | #72 | Exceptional 11.3% |
| Immigrants | Belgium | 97.2 /100 | #73 | Exceptional 11.3% |
| Carpatho Rusyns | 97.2 /100 | #74 | Exceptional 11.3% |
| Immigrants | Eastern Europe | 97.0 /100 | #75 | Exceptional 11.3% |
| Immigrants | North America | 96.8 /100 | #76 | Exceptional 11.3% |
| Immigrants | Eastern Asia | 96.7 /100 | #77 | Exceptional 11.3% |
| Dutch | 96.7 /100 | #78 | Exceptional 11.3% |
Demographics Similar to Immigrants from Chile by Poverty
In terms of poverty, the demographic groups most similar to Immigrants from Chile are Venezuelan (12.2%, a difference of 0.020%), Immigrants from Venezuela (12.2%, a difference of 0.020%), Colombian (12.2%, a difference of 0.11%), Immigrants from Albania (12.2%, a difference of 0.11%), and White/Caucasian (12.3%, a difference of 0.13%).
| Demographics | Rating | Rank | Poverty |
| Immigrants | Nepal | 60.4 /100 | #160 | Good 12.2% |
| Immigrants | Fiji | 59.1 /100 | #161 | Average 12.2% |
| Ethiopians | 59.1 /100 | #162 | Average 12.2% |
| Immigrants | Ethiopia | 58.6 /100 | #163 | Average 12.2% |
| Colombians | 57.8 /100 | #164 | Average 12.2% |
| Immigrants | Albania | 57.7 /100 | #165 | Average 12.2% |
| Venezuelans | 56.9 /100 | #166 | Average 12.2% |
| Immigrants | Chile | 56.7 /100 | #167 | Average 12.2% |
| Immigrants | Venezuela | 56.5 /100 | #168 | Average 12.2% |
| Whites/Caucasians | 55.4 /100 | #169 | Average 12.3% |
| Immigrants | Oceania | 54.6 /100 | #170 | Average 12.3% |
| Immigrants | Spain | 51.3 /100 | #171 | Average 12.3% |
| Immigrants | Portugal | 50.5 /100 | #172 | Average 12.3% |
| Celtics | 50.1 /100 | #173 | Average 12.3% |
| Lebanese | 50.0 /100 | #174 | Average 12.3% |