Senegalese vs Lumbee Poverty
COMPARE
Senegalese
Lumbee
Poverty
Poverty Comparison
Senegalese
Lumbee
15.3%
POVERTY
0.0/ 100
METRIC RATING
299th/ 347
METRIC RANK
21.9%
POVERTY
0.0/ 100
METRIC RATING
344th/ 347
METRIC RANK
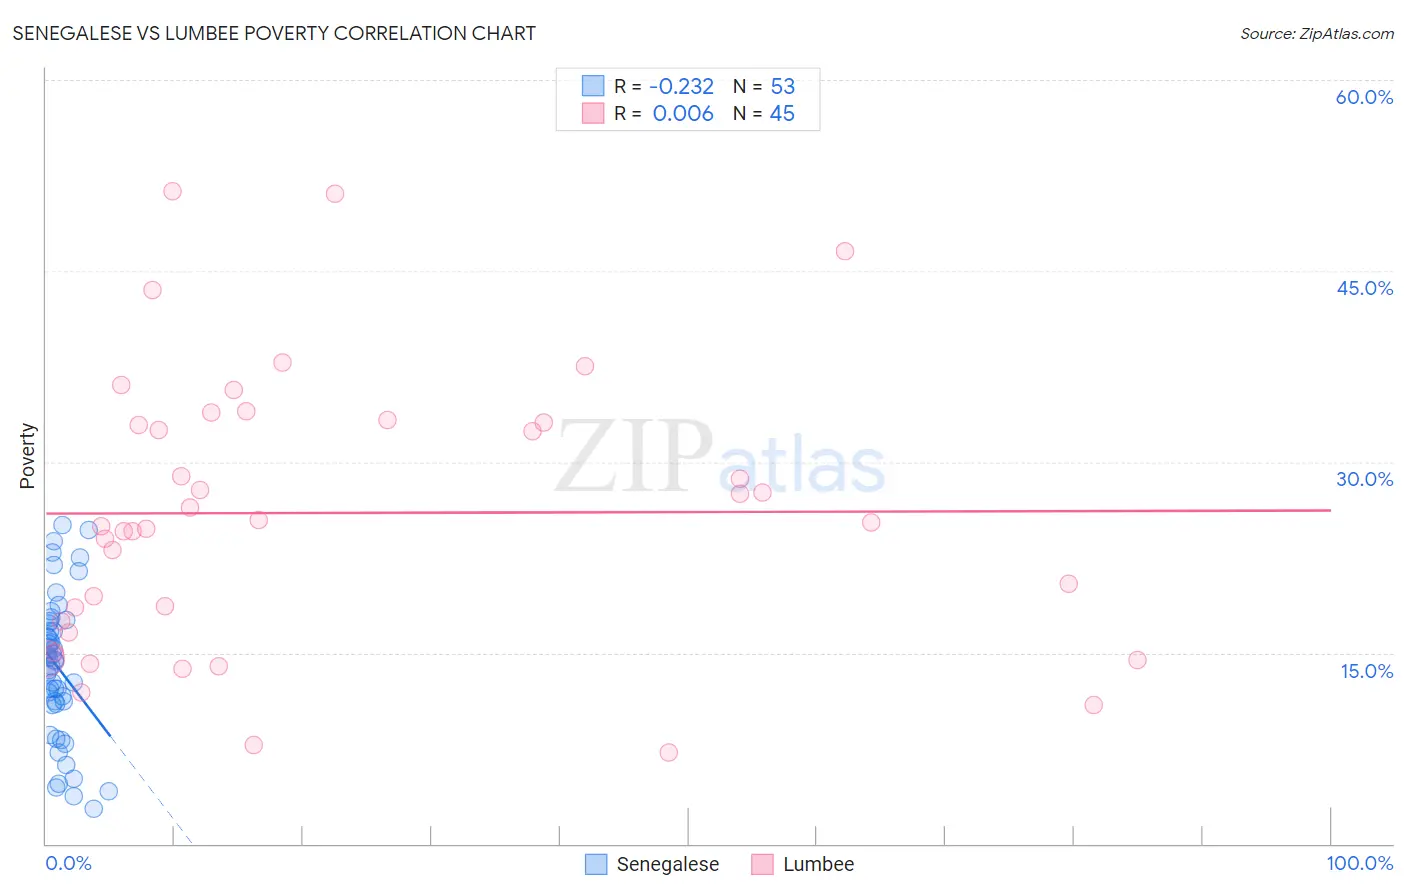
Senegalese vs Lumbee Poverty Correlation Chart
The statistical analysis conducted on geographies consisting of 78,114,751 people shows a weak negative correlation between the proportion of Senegalese and poverty level in the United States with a correlation coefficient (R) of -0.232 and weighted average of 15.3%. Similarly, the statistical analysis conducted on geographies consisting of 92,257,257 people shows no correlation between the proportion of Lumbee and poverty level in the United States with a correlation coefficient (R) of 0.006 and weighted average of 21.9%, a difference of 43.2%.
Poverty Correlation Summary
| Measurement | Senegalese | Lumbee |
| Minimum | 2.8% | 7.2% |
| Maximum | 25.1% | 51.2% |
| Range | 22.3% | 44.0% |
| Mean | 13.8% | 26.0% |
| Median | 14.3% | 25.2% |
| Interquartile 25% (IQ1) | 11.0% | 17.0% |
| Interquartile 75% (IQ3) | 17.4% | 33.2% |
| Interquartile Range (IQR) | 6.4% | 16.2% |
| Standard Deviation (Sample) | 5.6% | 10.8% |
| Standard Deviation (Population) | 5.6% | 10.7% |
Similar Demographics by Poverty
Demographics Similar to Senegalese by Poverty
In terms of poverty, the demographic groups most similar to Senegalese are Immigrants from Senegal (15.3%, a difference of 0.090%), Immigrants from Bangladesh (15.3%, a difference of 0.24%), Hispanic or Latino (15.3%, a difference of 0.29%), Guatemalan (15.3%, a difference of 0.30%), and Immigrants from Central America (15.4%, a difference of 0.38%).
| Demographics | Rating | Rank | Poverty |
| Indonesians | 0.0 /100 | #292 | Tragic 15.1% |
| Immigrants | Zaire | 0.0 /100 | #293 | Tragic 15.1% |
| Blackfeet | 0.0 /100 | #294 | Tragic 15.2% |
| Guatemalans | 0.0 /100 | #295 | Tragic 15.3% |
| Hispanics or Latinos | 0.0 /100 | #296 | Tragic 15.3% |
| Immigrants | Bangladesh | 0.0 /100 | #297 | Tragic 15.3% |
| Immigrants | Senegal | 0.0 /100 | #298 | Tragic 15.3% |
| Senegalese | 0.0 /100 | #299 | Tragic 15.3% |
| Immigrants | Central America | 0.0 /100 | #300 | Tragic 15.4% |
| Bahamians | 0.0 /100 | #301 | Tragic 15.4% |
| Somalis | 0.0 /100 | #302 | Tragic 15.4% |
| Immigrants | Caribbean | 0.0 /100 | #303 | Tragic 15.5% |
| Immigrants | Mexico | 0.0 /100 | #304 | Tragic 15.5% |
| Immigrants | Guatemala | 0.0 /100 | #305 | Tragic 15.5% |
| Creek | 0.0 /100 | #306 | Tragic 15.6% |
Demographics Similar to Lumbee by Poverty
In terms of poverty, the demographic groups most similar to Lumbee are Pima (21.9%, a difference of 0.26%), Immigrants from Yemen (21.5%, a difference of 1.9%), Hopi (20.8%, a difference of 5.1%), Yup'ik (20.8%, a difference of 5.3%), and Navajo (23.1%, a difference of 5.4%).
| Demographics | Rating | Rank | Poverty |
| Houma | 0.0 /100 | #333 | Tragic 18.4% |
| Apache | 0.0 /100 | #334 | Tragic 18.4% |
| Cheyenne | 0.0 /100 | #335 | Tragic 18.9% |
| Pueblo | 0.0 /100 | #336 | Tragic 19.4% |
| Sioux | 0.0 /100 | #337 | Tragic 19.8% |
| Yuman | 0.0 /100 | #338 | Tragic 20.2% |
| Crow | 0.0 /100 | #339 | Tragic 20.7% |
| Yup'ik | 0.0 /100 | #340 | Tragic 20.8% |
| Hopi | 0.0 /100 | #341 | Tragic 20.8% |
| Immigrants | Yemen | 0.0 /100 | #342 | Tragic 21.5% |
| Pima | 0.0 /100 | #343 | Tragic 21.9% |
| Lumbee | 0.0 /100 | #344 | Tragic 21.9% |
| Navajo | 0.0 /100 | #345 | Tragic 23.1% |
| Puerto Ricans | 0.0 /100 | #346 | Tragic 23.7% |
| Tohono O'odham | 0.0 /100 | #347 | Tragic 24.4% |