Russian vs Lumbee Poverty
COMPARE
Russian
Lumbee
Poverty
Poverty Comparison
Russians
Lumbee
10.9%
POVERTY
99.3/ 100
METRIC RATING
40th/ 347
METRIC RANK
21.9%
POVERTY
0.0/ 100
METRIC RATING
344th/ 347
METRIC RANK
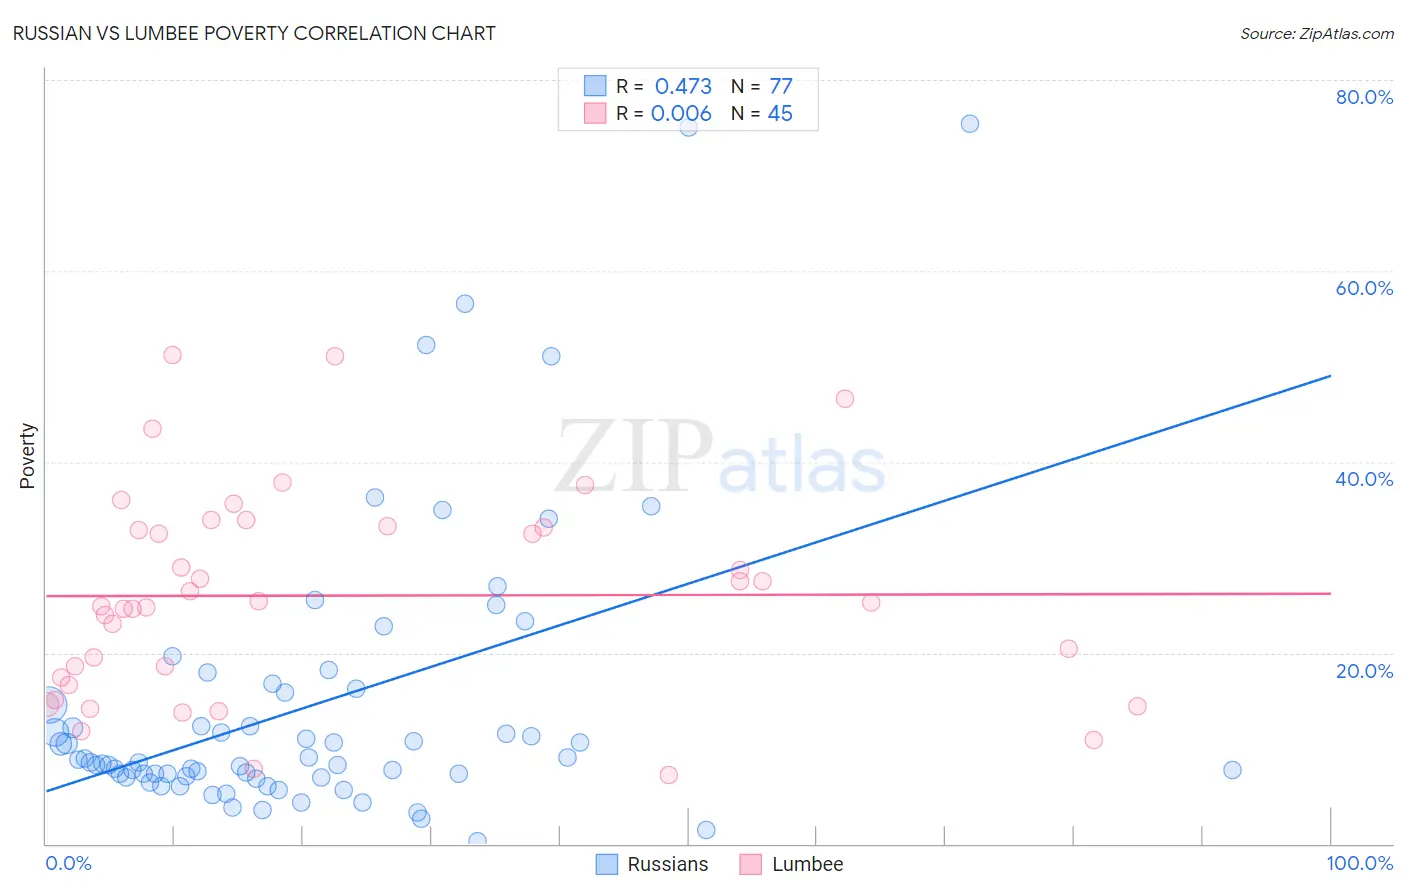
Russian vs Lumbee Poverty Correlation Chart
The statistical analysis conducted on geographies consisting of 511,663,419 people shows a moderate positive correlation between the proportion of Russians and poverty level in the United States with a correlation coefficient (R) of 0.473 and weighted average of 10.9%. Similarly, the statistical analysis conducted on geographies consisting of 92,257,257 people shows no correlation between the proportion of Lumbee and poverty level in the United States with a correlation coefficient (R) of 0.006 and weighted average of 21.9%, a difference of 101.9%.
Poverty Correlation Summary
| Measurement | Russian | Lumbee |
| Minimum | 0.31% | 7.2% |
| Maximum | 75.4% | 51.2% |
| Range | 75.1% | 44.0% |
| Mean | 14.6% | 26.0% |
| Median | 8.6% | 25.2% |
| Interquartile 25% (IQ1) | 7.0% | 17.0% |
| Interquartile 75% (IQ3) | 16.1% | 33.2% |
| Interquartile Range (IQR) | 9.1% | 16.2% |
| Standard Deviation (Sample) | 15.1% | 10.8% |
| Standard Deviation (Population) | 15.0% | 10.7% |
Similar Demographics by Poverty
Demographics Similar to Russians by Poverty
In terms of poverty, the demographic groups most similar to Russians are Immigrants from Pakistan (10.8%, a difference of 0.050%), Immigrants from Iran (10.9%, a difference of 0.090%), Czech (10.8%, a difference of 0.13%), Immigrants from Greece (10.8%, a difference of 0.18%), and Cypriot (10.8%, a difference of 0.27%).
| Demographics | Rating | Rank | Poverty |
| Macedonians | 99.4 /100 | #33 | Exceptional 10.8% |
| Immigrants | Poland | 99.4 /100 | #34 | Exceptional 10.8% |
| Tongans | 99.4 /100 | #35 | Exceptional 10.8% |
| Cypriots | 99.3 /100 | #36 | Exceptional 10.8% |
| Immigrants | Greece | 99.3 /100 | #37 | Exceptional 10.8% |
| Czechs | 99.3 /100 | #38 | Exceptional 10.8% |
| Immigrants | Pakistan | 99.3 /100 | #39 | Exceptional 10.8% |
| Russians | 99.3 /100 | #40 | Exceptional 10.9% |
| Immigrants | Iran | 99.2 /100 | #41 | Exceptional 10.9% |
| Koreans | 99.2 /100 | #42 | Exceptional 10.9% |
| Immigrants | Singapore | 99.2 /100 | #43 | Exceptional 10.9% |
| Immigrants | Moldova | 99.1 /100 | #44 | Exceptional 10.9% |
| Turks | 98.9 /100 | #45 | Exceptional 11.0% |
| Immigrants | Czechoslovakia | 98.9 /100 | #46 | Exceptional 11.0% |
| Immigrants | Romania | 98.9 /100 | #47 | Exceptional 11.0% |
Demographics Similar to Lumbee by Poverty
In terms of poverty, the demographic groups most similar to Lumbee are Pima (21.9%, a difference of 0.26%), Immigrants from Yemen (21.5%, a difference of 1.9%), Hopi (20.8%, a difference of 5.1%), Yup'ik (20.8%, a difference of 5.3%), and Navajo (23.1%, a difference of 5.4%).
| Demographics | Rating | Rank | Poverty |
| Houma | 0.0 /100 | #333 | Tragic 18.4% |
| Apache | 0.0 /100 | #334 | Tragic 18.4% |
| Cheyenne | 0.0 /100 | #335 | Tragic 18.9% |
| Pueblo | 0.0 /100 | #336 | Tragic 19.4% |
| Sioux | 0.0 /100 | #337 | Tragic 19.8% |
| Yuman | 0.0 /100 | #338 | Tragic 20.2% |
| Crow | 0.0 /100 | #339 | Tragic 20.7% |
| Yup'ik | 0.0 /100 | #340 | Tragic 20.8% |
| Hopi | 0.0 /100 | #341 | Tragic 20.8% |
| Immigrants | Yemen | 0.0 /100 | #342 | Tragic 21.5% |
| Pima | 0.0 /100 | #343 | Tragic 21.9% |
| Lumbee | 0.0 /100 | #344 | Tragic 21.9% |
| Navajo | 0.0 /100 | #345 | Tragic 23.1% |
| Puerto Ricans | 0.0 /100 | #346 | Tragic 23.7% |
| Tohono O'odham | 0.0 /100 | #347 | Tragic 24.4% |