Zimbabwean vs Cape Verdean Poverty
COMPARE
Zimbabwean
Cape Verdean
Poverty
Poverty Comparison
Zimbabweans
Cape Verdeans
11.3%
POVERTY
97.3/ 100
METRIC RATING
71st/ 347
METRIC RANK
14.4%
POVERTY
0.1/ 100
METRIC RATING
260th/ 347
METRIC RANK
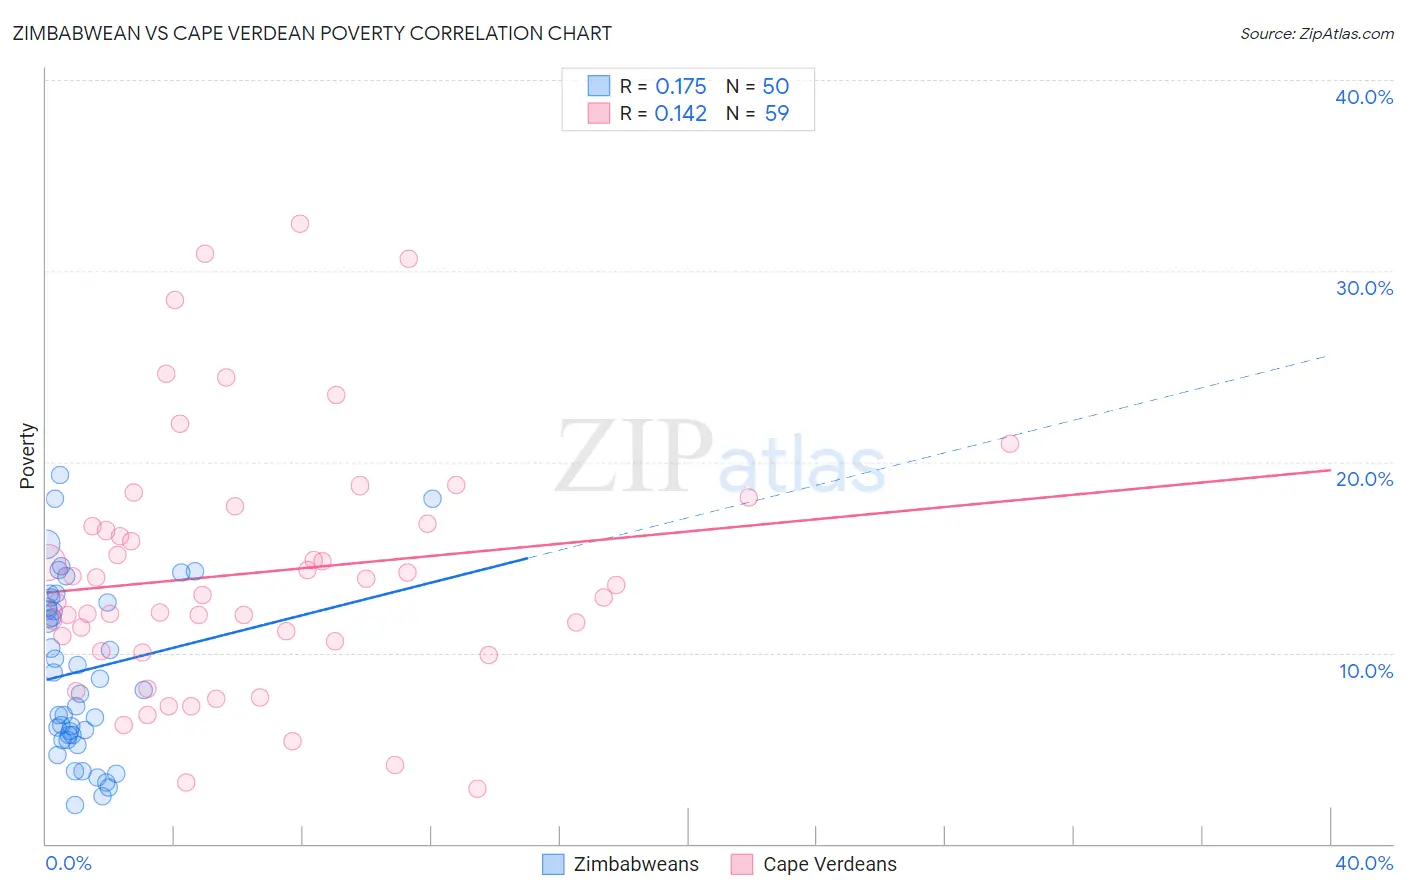
Zimbabwean vs Cape Verdean Poverty Correlation Chart
The statistical analysis conducted on geographies consisting of 69,186,100 people shows a poor positive correlation between the proportion of Zimbabweans and poverty level in the United States with a correlation coefficient (R) of 0.175 and weighted average of 11.3%. Similarly, the statistical analysis conducted on geographies consisting of 107,560,730 people shows a poor positive correlation between the proportion of Cape Verdeans and poverty level in the United States with a correlation coefficient (R) of 0.142 and weighted average of 14.4%, a difference of 27.5%.
Poverty Correlation Summary
| Measurement | Zimbabwean | Cape Verdean |
| Minimum | 2.0% | 2.9% |
| Maximum | 19.3% | 32.5% |
| Range | 17.3% | 29.6% |
| Mean | 9.1% | 14.2% |
| Median | 8.4% | 13.0% |
| Interquartile 25% (IQ1) | 5.7% | 10.1% |
| Interquartile 75% (IQ3) | 12.6% | 16.7% |
| Interquartile Range (IQR) | 6.9% | 6.6% |
| Standard Deviation (Sample) | 4.5% | 6.6% |
| Standard Deviation (Population) | 4.5% | 6.6% |
Similar Demographics by Poverty
Demographics Similar to Zimbabweans by Poverty
In terms of poverty, the demographic groups most similar to Zimbabweans are Immigrants from Canada (11.3%, a difference of 0.020%), European (11.3%, a difference of 0.020%), Immigrants from Belgium (11.3%, a difference of 0.020%), Carpatho Rusyn (11.3%, a difference of 0.070%), and Serbian (11.2%, a difference of 0.11%).
| Demographics | Rating | Rank | Poverty |
| Swiss | 97.7 /100 | #64 | Exceptional 11.2% |
| Immigrants | Asia | 97.5 /100 | #65 | Exceptional 11.2% |
| Immigrants | Netherlands | 97.5 /100 | #66 | Exceptional 11.2% |
| Immigrants | Australia | 97.4 /100 | #67 | Exceptional 11.2% |
| Slovaks | 97.4 /100 | #68 | Exceptional 11.2% |
| Serbians | 97.4 /100 | #69 | Exceptional 11.2% |
| Immigrants | Canada | 97.3 /100 | #70 | Exceptional 11.3% |
| Zimbabweans | 97.3 /100 | #71 | Exceptional 11.3% |
| Europeans | 97.2 /100 | #72 | Exceptional 11.3% |
| Immigrants | Belgium | 97.2 /100 | #73 | Exceptional 11.3% |
| Carpatho Rusyns | 97.2 /100 | #74 | Exceptional 11.3% |
| Immigrants | Eastern Europe | 97.0 /100 | #75 | Exceptional 11.3% |
| Immigrants | North America | 96.8 /100 | #76 | Exceptional 11.3% |
| Immigrants | Eastern Asia | 96.7 /100 | #77 | Exceptional 11.3% |
| Dutch | 96.7 /100 | #78 | Exceptional 11.3% |
Demographics Similar to Cape Verdeans by Poverty
In terms of poverty, the demographic groups most similar to Cape Verdeans are Cherokee (14.4%, a difference of 0.020%), Immigrants from Nicaragua (14.3%, a difference of 0.080%), Immigrants from Liberia (14.4%, a difference of 0.18%), Ottawa (14.3%, a difference of 0.35%), and Trinidadian and Tobagonian (14.3%, a difference of 0.36%).
| Demographics | Rating | Rank | Poverty |
| Immigrants | Trinidad and Tobago | 0.2 /100 | #253 | Tragic 14.2% |
| Immigrants | El Salvador | 0.1 /100 | #254 | Tragic 14.3% |
| Immigrants | Ecuador | 0.1 /100 | #255 | Tragic 14.3% |
| Mexican American Indians | 0.1 /100 | #256 | Tragic 14.3% |
| Trinidadians and Tobagonians | 0.1 /100 | #257 | Tragic 14.3% |
| Ottawa | 0.1 /100 | #258 | Tragic 14.3% |
| Immigrants | Nicaragua | 0.1 /100 | #259 | Tragic 14.3% |
| Cape Verdeans | 0.1 /100 | #260 | Tragic 14.4% |
| Cherokee | 0.1 /100 | #261 | Tragic 14.4% |
| Immigrants | Liberia | 0.1 /100 | #262 | Tragic 14.4% |
| Jamaicans | 0.1 /100 | #263 | Tragic 14.4% |
| Immigrants | Jamaica | 0.1 /100 | #264 | Tragic 14.4% |
| Immigrants | Guyana | 0.1 /100 | #265 | Tragic 14.5% |
| Guyanese | 0.1 /100 | #266 | Tragic 14.5% |
| Iroquois | 0.1 /100 | #267 | Tragic 14.5% |