Immigrants from Armenia vs Lumbee Poverty
COMPARE
Immigrants from Armenia
Lumbee
Poverty
Poverty Comparison
Immigrants from Armenia
Lumbee
13.9%
POVERTY
0.5/ 100
METRIC RATING
236th/ 347
METRIC RANK
21.9%
POVERTY
0.0/ 100
METRIC RATING
344th/ 347
METRIC RANK
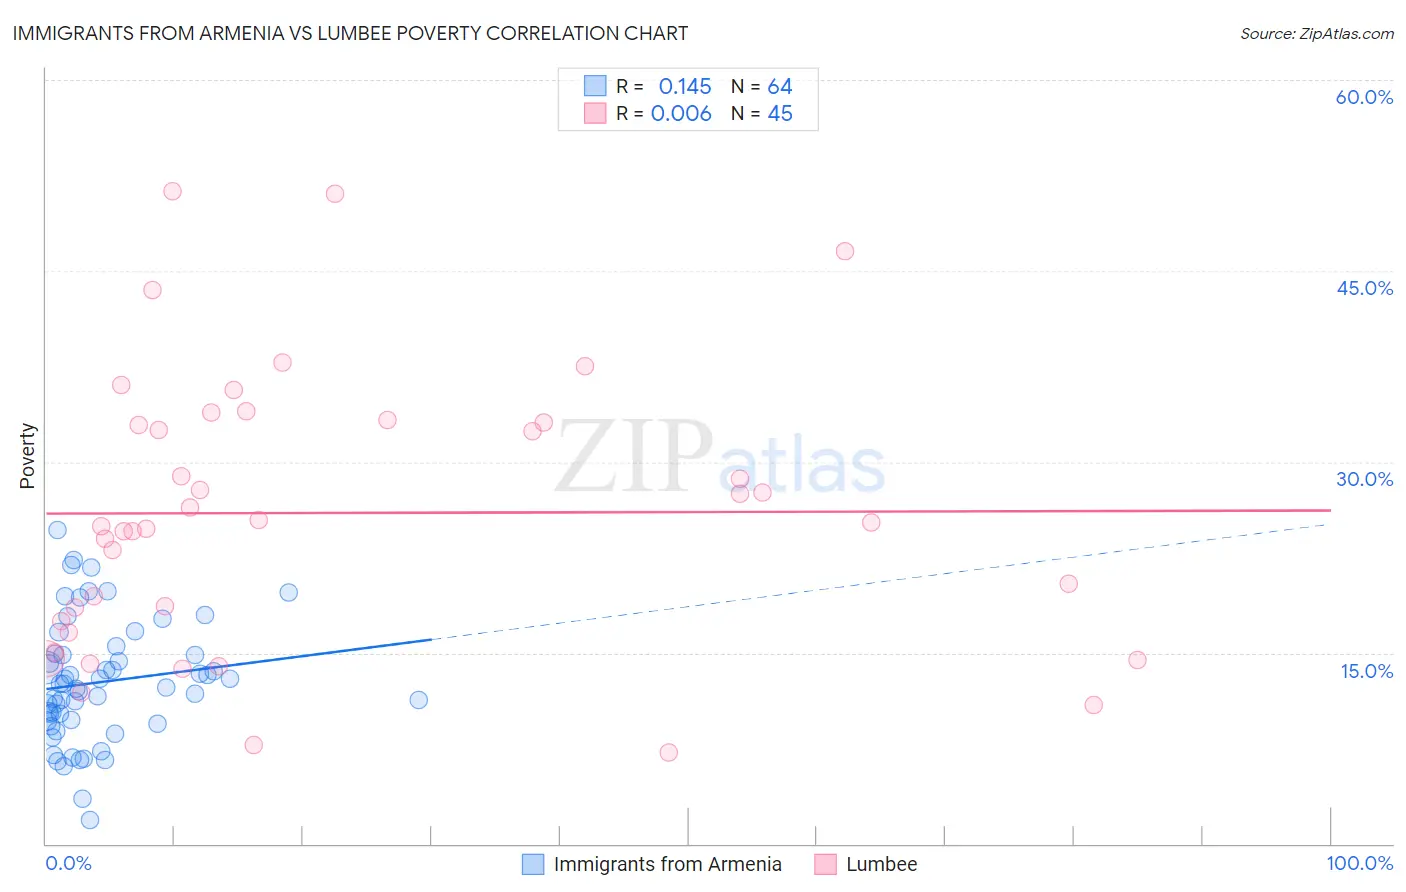
Immigrants from Armenia vs Lumbee Poverty Correlation Chart
The statistical analysis conducted on geographies consisting of 97,715,591 people shows a poor positive correlation between the proportion of Immigrants from Armenia and poverty level in the United States with a correlation coefficient (R) of 0.145 and weighted average of 13.9%. Similarly, the statistical analysis conducted on geographies consisting of 92,257,257 people shows no correlation between the proportion of Lumbee and poverty level in the United States with a correlation coefficient (R) of 0.006 and weighted average of 21.9%, a difference of 58.0%.
Poverty Correlation Summary
| Measurement | Immigrants from Armenia | Lumbee |
| Minimum | 1.8% | 7.2% |
| Maximum | 24.7% | 51.2% |
| Range | 22.8% | 44.0% |
| Mean | 12.7% | 26.0% |
| Median | 12.4% | 25.2% |
| Interquartile 25% (IQ1) | 9.7% | 17.0% |
| Interquartile 75% (IQ3) | 14.9% | 33.2% |
| Interquartile Range (IQR) | 5.2% | 16.2% |
| Standard Deviation (Sample) | 4.7% | 10.8% |
| Standard Deviation (Population) | 4.7% | 10.7% |
Similar Demographics by Poverty
Demographics Similar to Immigrants from Armenia by Poverty
In terms of poverty, the demographic groups most similar to Immigrants from Armenia are French American Indian (13.9%, a difference of 0.020%), Cuban (13.9%, a difference of 0.040%), Ghanaian (13.9%, a difference of 0.15%), Immigrants from Laos (13.8%, a difference of 0.47%), and Nicaraguan (13.9%, a difference of 0.50%).
| Demographics | Rating | Rank | Poverty |
| Osage | 1.5 /100 | #229 | Tragic 13.6% |
| Alaskan Athabascans | 1.5 /100 | #230 | Tragic 13.6% |
| Nigerians | 1.4 /100 | #231 | Tragic 13.6% |
| Fijians | 0.8 /100 | #232 | Tragic 13.7% |
| Immigrants | Saudi Arabia | 0.8 /100 | #233 | Tragic 13.8% |
| Immigrants | Laos | 0.7 /100 | #234 | Tragic 13.8% |
| Cubans | 0.6 /100 | #235 | Tragic 13.9% |
| Immigrants | Armenia | 0.5 /100 | #236 | Tragic 13.9% |
| French American Indians | 0.5 /100 | #237 | Tragic 13.9% |
| Ghanaians | 0.5 /100 | #238 | Tragic 13.9% |
| Nicaraguans | 0.4 /100 | #239 | Tragic 13.9% |
| Immigrants | Middle Africa | 0.4 /100 | #240 | Tragic 14.0% |
| Salvadorans | 0.4 /100 | #241 | Tragic 14.0% |
| Ecuadorians | 0.4 /100 | #242 | Tragic 14.0% |
| Sudanese | 0.3 /100 | #243 | Tragic 14.0% |
Demographics Similar to Lumbee by Poverty
In terms of poverty, the demographic groups most similar to Lumbee are Pima (21.9%, a difference of 0.26%), Immigrants from Yemen (21.5%, a difference of 1.9%), Hopi (20.8%, a difference of 5.1%), Yup'ik (20.8%, a difference of 5.3%), and Navajo (23.1%, a difference of 5.4%).
| Demographics | Rating | Rank | Poverty |
| Houma | 0.0 /100 | #333 | Tragic 18.4% |
| Apache | 0.0 /100 | #334 | Tragic 18.4% |
| Cheyenne | 0.0 /100 | #335 | Tragic 18.9% |
| Pueblo | 0.0 /100 | #336 | Tragic 19.4% |
| Sioux | 0.0 /100 | #337 | Tragic 19.8% |
| Yuman | 0.0 /100 | #338 | Tragic 20.2% |
| Crow | 0.0 /100 | #339 | Tragic 20.7% |
| Yup'ik | 0.0 /100 | #340 | Tragic 20.8% |
| Hopi | 0.0 /100 | #341 | Tragic 20.8% |
| Immigrants | Yemen | 0.0 /100 | #342 | Tragic 21.5% |
| Pima | 0.0 /100 | #343 | Tragic 21.9% |
| Lumbee | 0.0 /100 | #344 | Tragic 21.9% |
| Navajo | 0.0 /100 | #345 | Tragic 23.1% |
| Puerto Ricans | 0.0 /100 | #346 | Tragic 23.7% |
| Tohono O'odham | 0.0 /100 | #347 | Tragic 24.4% |