Zimbabwean vs Lumbee College, 1 year or more
COMPARE
Zimbabwean
Lumbee
College, 1 year or more
College, 1 year or more Comparison
Zimbabweans
Lumbee
64.2%
COLLEGE, 1 YEAR OR MORE
99.8/ 100
METRIC RATING
54th/ 347
METRIC RANK
48.9%
COLLEGE, 1 YEAR OR MORE
0.0/ 100
METRIC RATING
334th/ 347
METRIC RANK
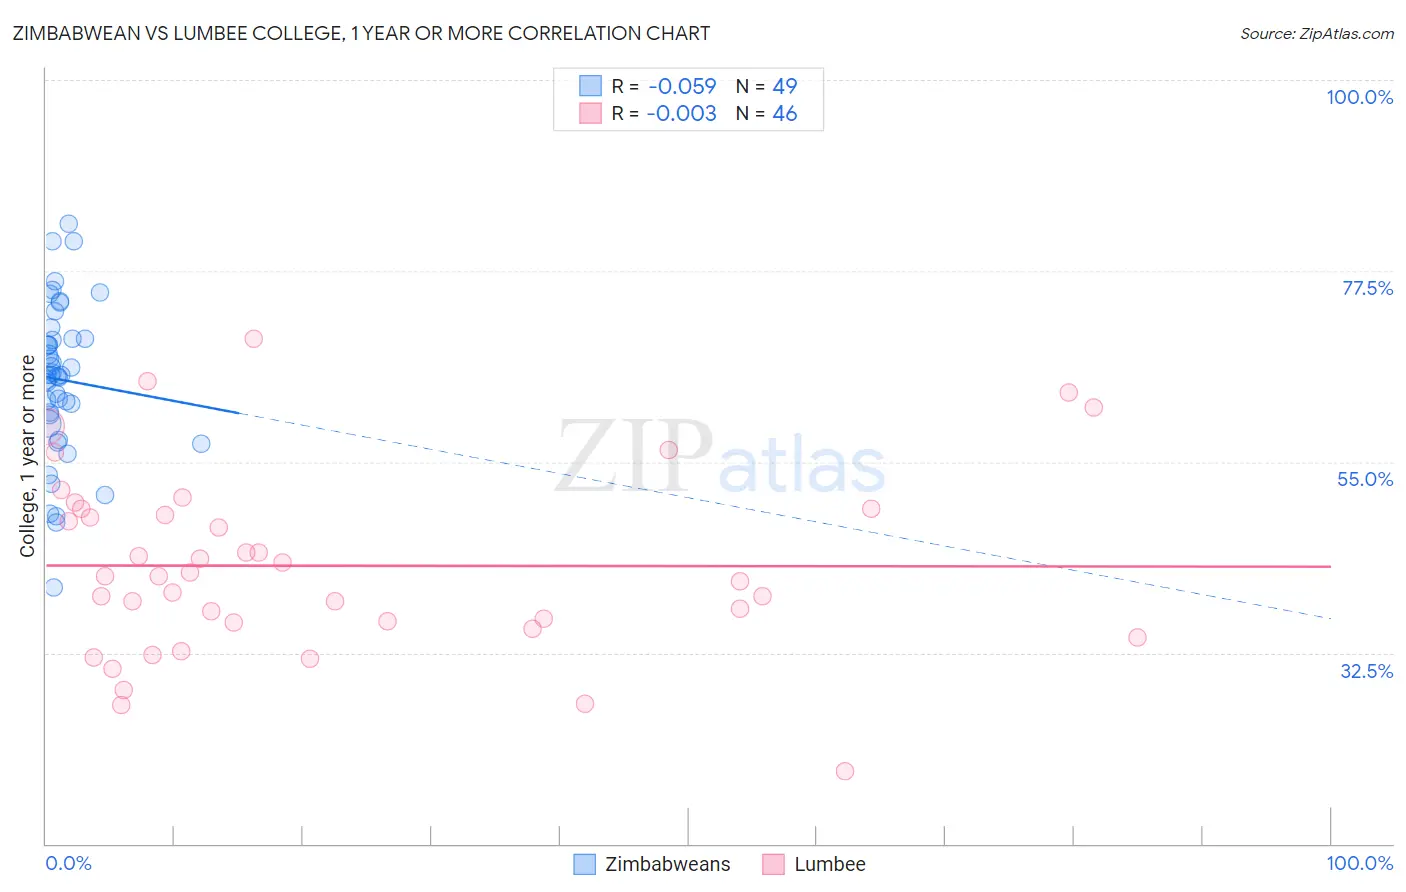
Zimbabwean vs Lumbee College, 1 year or more Correlation Chart
The statistical analysis conducted on geographies consisting of 69,202,005 people shows a slight negative correlation between the proportion of Zimbabweans and percentage of population with at least college, 1 year or more education in the United States with a correlation coefficient (R) of -0.059 and weighted average of 64.2%. Similarly, the statistical analysis conducted on geographies consisting of 92,299,068 people shows no correlation between the proportion of Lumbee and percentage of population with at least college, 1 year or more education in the United States with a correlation coefficient (R) of -0.003 and weighted average of 48.9%, a difference of 31.4%.
College, 1 year or more Correlation Summary
| Measurement | Zimbabwean | Lumbee |
| Minimum | 40.2% | 18.5% |
| Maximum | 83.0% | 69.5% |
| Range | 42.8% | 51.0% |
| Mean | 64.7% | 42.8% |
| Median | 65.2% | 41.5% |
| Interquartile 25% (IQ1) | 60.1% | 36.0% |
| Interquartile 75% (IQ3) | 69.5% | 49.4% |
| Interquartile Range (IQR) | 9.4% | 13.4% |
| Standard Deviation (Sample) | 9.0% | 10.9% |
| Standard Deviation (Population) | 8.9% | 10.8% |
Similar Demographics by College, 1 year or more
Demographics Similar to Zimbabweans by College, 1 year or more
In terms of college, 1 year or more, the demographic groups most similar to Zimbabweans are Asian (64.2%, a difference of 0.030%), Immigrants from Netherlands (64.2%, a difference of 0.050%), Immigrants from Belarus (64.1%, a difference of 0.12%), Immigrants from Czechoslovakia (64.1%, a difference of 0.15%), and South African (64.1%, a difference of 0.16%).
| Demographics | Rating | Rank | College, 1 year or more |
| Australians | 99.9 /100 | #47 | Exceptional 64.6% |
| Immigrants | Bulgaria | 99.9 /100 | #48 | Exceptional 64.6% |
| New Zealanders | 99.9 /100 | #49 | Exceptional 64.6% |
| Immigrants | Austria | 99.8 /100 | #50 | Exceptional 64.4% |
| Immigrants | Malaysia | 99.8 /100 | #51 | Exceptional 64.3% |
| Immigrants | Netherlands | 99.8 /100 | #52 | Exceptional 64.2% |
| Asians | 99.8 /100 | #53 | Exceptional 64.2% |
| Zimbabweans | 99.8 /100 | #54 | Exceptional 64.2% |
| Immigrants | Belarus | 99.7 /100 | #55 | Exceptional 64.1% |
| Immigrants | Czechoslovakia | 99.7 /100 | #56 | Exceptional 64.1% |
| South Africans | 99.7 /100 | #57 | Exceptional 64.1% |
| Immigrants | Asia | 99.7 /100 | #58 | Exceptional 64.0% |
| Immigrants | Serbia | 99.6 /100 | #59 | Exceptional 63.8% |
| Immigrants | Kazakhstan | 99.5 /100 | #60 | Exceptional 63.6% |
| Bolivians | 99.5 /100 | #61 | Exceptional 63.5% |
Demographics Similar to Lumbee by College, 1 year or more
In terms of college, 1 year or more, the demographic groups most similar to Lumbee are Yuman (48.7%, a difference of 0.28%), Immigrants from Dominican Republic (49.1%, a difference of 0.58%), Spanish American Indian (48.5%, a difference of 0.72%), Pennsylvania German (48.5%, a difference of 0.73%), and Mexican (49.2%, a difference of 0.75%).
| Demographics | Rating | Rank | College, 1 year or more |
| Menominee | 0.0 /100 | #327 | Tragic 50.6% |
| Dutch West Indians | 0.0 /100 | #328 | Tragic 50.5% |
| Cape Verdeans | 0.0 /100 | #329 | Tragic 50.3% |
| Natives/Alaskans | 0.0 /100 | #330 | Tragic 50.2% |
| Immigrants | Yemen | 0.0 /100 | #331 | Tragic 50.0% |
| Mexicans | 0.0 /100 | #332 | Tragic 49.2% |
| Immigrants | Dominican Republic | 0.0 /100 | #333 | Tragic 49.1% |
| Lumbee | 0.0 /100 | #334 | Tragic 48.9% |
| Yuman | 0.0 /100 | #335 | Tragic 48.7% |
| Spanish American Indians | 0.0 /100 | #336 | Tragic 48.5% |
| Pennsylvania Germans | 0.0 /100 | #337 | Tragic 48.5% |
| Immigrants | Central America | 0.0 /100 | #338 | Tragic 48.5% |
| Immigrants | Azores | 0.0 /100 | #339 | Tragic 48.4% |
| Immigrants | Cabo Verde | 0.0 /100 | #340 | Tragic 48.1% |
| Immigrants | Mexico | 0.0 /100 | #341 | Tragic 47.5% |