Zimbabwean vs Hopi Male Poverty
COMPARE
Zimbabwean
Hopi
Male Poverty
Male Poverty Comparison
Zimbabweans
Hopi
10.2%
MALE POVERTY
97.5/ 100
METRIC RATING
65th/ 347
METRIC RANK
20.8%
MALE POVERTY
0.0/ 100
METRIC RATING
344th/ 347
METRIC RANK
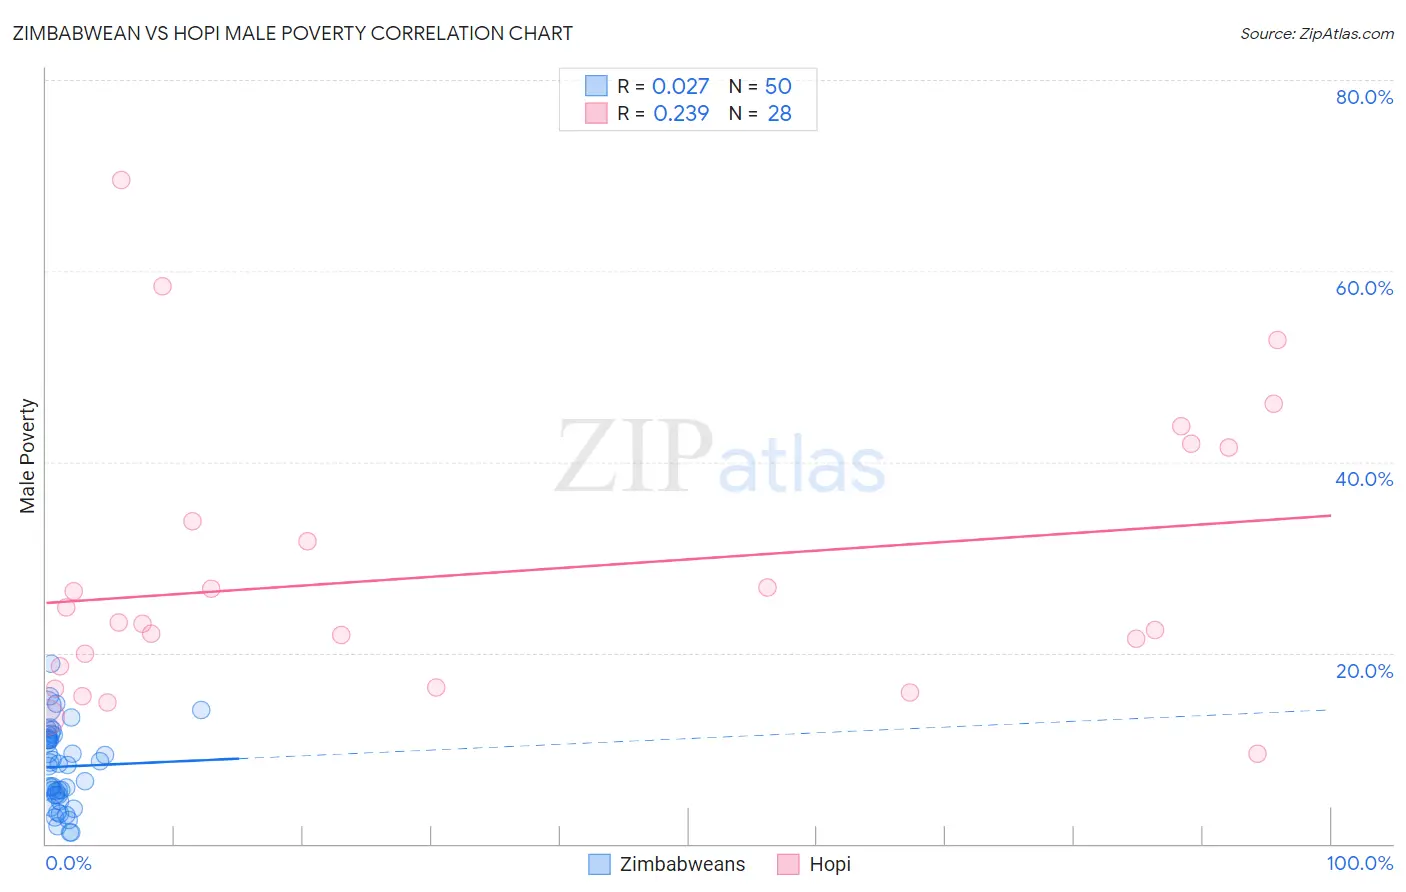
Zimbabwean vs Hopi Male Poverty Correlation Chart
The statistical analysis conducted on geographies consisting of 69,180,294 people shows no correlation between the proportion of Zimbabweans and poverty level among males in the United States with a correlation coefficient (R) of 0.027 and weighted average of 10.2%. Similarly, the statistical analysis conducted on geographies consisting of 74,731,622 people shows a weak positive correlation between the proportion of Hopi and poverty level among males in the United States with a correlation coefficient (R) of 0.239 and weighted average of 20.8%, a difference of 104.3%.
Male Poverty Correlation Summary
| Measurement | Zimbabwean | Hopi |
| Minimum | 1.2% | 9.5% |
| Maximum | 18.8% | 69.5% |
| Range | 17.7% | 60.0% |
| Mean | 8.1% | 28.5% |
| Median | 8.3% | 23.1% |
| Interquartile 25% (IQ1) | 5.1% | 17.4% |
| Interquartile 75% (IQ3) | 11.1% | 37.7% |
| Interquartile Range (IQR) | 5.9% | 20.2% |
| Standard Deviation (Sample) | 4.1% | 14.8% |
| Standard Deviation (Population) | 4.1% | 14.6% |
Similar Demographics by Male Poverty
Demographics Similar to Zimbabweans by Male Poverty
In terms of male poverty, the demographic groups most similar to Zimbabweans are Serbian (10.2%, a difference of 0.010%), Swiss (10.2%, a difference of 0.070%), Immigrants from Netherlands (10.2%, a difference of 0.18%), Immigrants from Sri Lanka (10.2%, a difference of 0.24%), and Slovak (10.2%, a difference of 0.30%).
| Demographics | Rating | Rank | Male Poverty |
| Scandinavians | 98.0 /100 | #58 | Exceptional 10.1% |
| Immigrants | Europe | 97.9 /100 | #59 | Exceptional 10.1% |
| Ukrainians | 97.9 /100 | #60 | Exceptional 10.1% |
| Austrians | 97.8 /100 | #61 | Exceptional 10.1% |
| Immigrants | Italy | 97.8 /100 | #62 | Exceptional 10.2% |
| Slovaks | 97.7 /100 | #63 | Exceptional 10.2% |
| Swiss | 97.5 /100 | #64 | Exceptional 10.2% |
| Zimbabweans | 97.5 /100 | #65 | Exceptional 10.2% |
| Serbians | 97.5 /100 | #66 | Exceptional 10.2% |
| Immigrants | Netherlands | 97.3 /100 | #67 | Exceptional 10.2% |
| Immigrants | Sri Lanka | 97.2 /100 | #68 | Exceptional 10.2% |
| Immigrants | Australia | 97.1 /100 | #69 | Exceptional 10.2% |
| Paraguayans | 97.1 /100 | #70 | Exceptional 10.2% |
| Europeans | 97.1 /100 | #71 | Exceptional 10.2% |
| Immigrants | Canada | 97.1 /100 | #72 | Exceptional 10.2% |
Demographics Similar to Hopi by Male Poverty
In terms of male poverty, the demographic groups most similar to Hopi are Yup'ik (20.4%, a difference of 2.1%), Pima (20.4%, a difference of 2.2%), Lumbee (20.2%, a difference of 3.0%), Immigrants from Yemen (20.1%, a difference of 3.3%), and Puerto Rican (22.0%, a difference of 5.9%).
| Demographics | Rating | Rank | Male Poverty |
| Natives/Alaskans | 0.0 /100 | #333 | Tragic 16.9% |
| Cheyenne | 0.0 /100 | #334 | Tragic 17.6% |
| Apache | 0.0 /100 | #335 | Tragic 17.7% |
| Pueblo | 0.0 /100 | #336 | Tragic 18.5% |
| Sioux | 0.0 /100 | #337 | Tragic 18.7% |
| Crow | 0.0 /100 | #338 | Tragic 19.1% |
| Yuman | 0.0 /100 | #339 | Tragic 19.5% |
| Immigrants | Yemen | 0.0 /100 | #340 | Tragic 20.1% |
| Lumbee | 0.0 /100 | #341 | Tragic 20.2% |
| Pima | 0.0 /100 | #342 | Tragic 20.4% |
| Yup'ik | 0.0 /100 | #343 | Tragic 20.4% |
| Hopi | 0.0 /100 | #344 | Tragic 20.8% |
| Puerto Ricans | 0.0 /100 | #345 | Tragic 22.0% |
| Navajo | 0.0 /100 | #346 | Tragic 22.3% |
| Tohono O'odham | 0.0 /100 | #347 | Tragic 22.9% |