Zimbabwean vs Immigrants from Japan Male Poverty
COMPARE
Zimbabwean
Immigrants from Japan
Male Poverty
Male Poverty Comparison
Zimbabweans
Immigrants from Japan
10.2%
MALE POVERTY
97.5/ 100
METRIC RATING
65th/ 347
METRIC RANK
10.0%
MALE POVERTY
98.8/ 100
METRIC RATING
48th/ 347
METRIC RANK
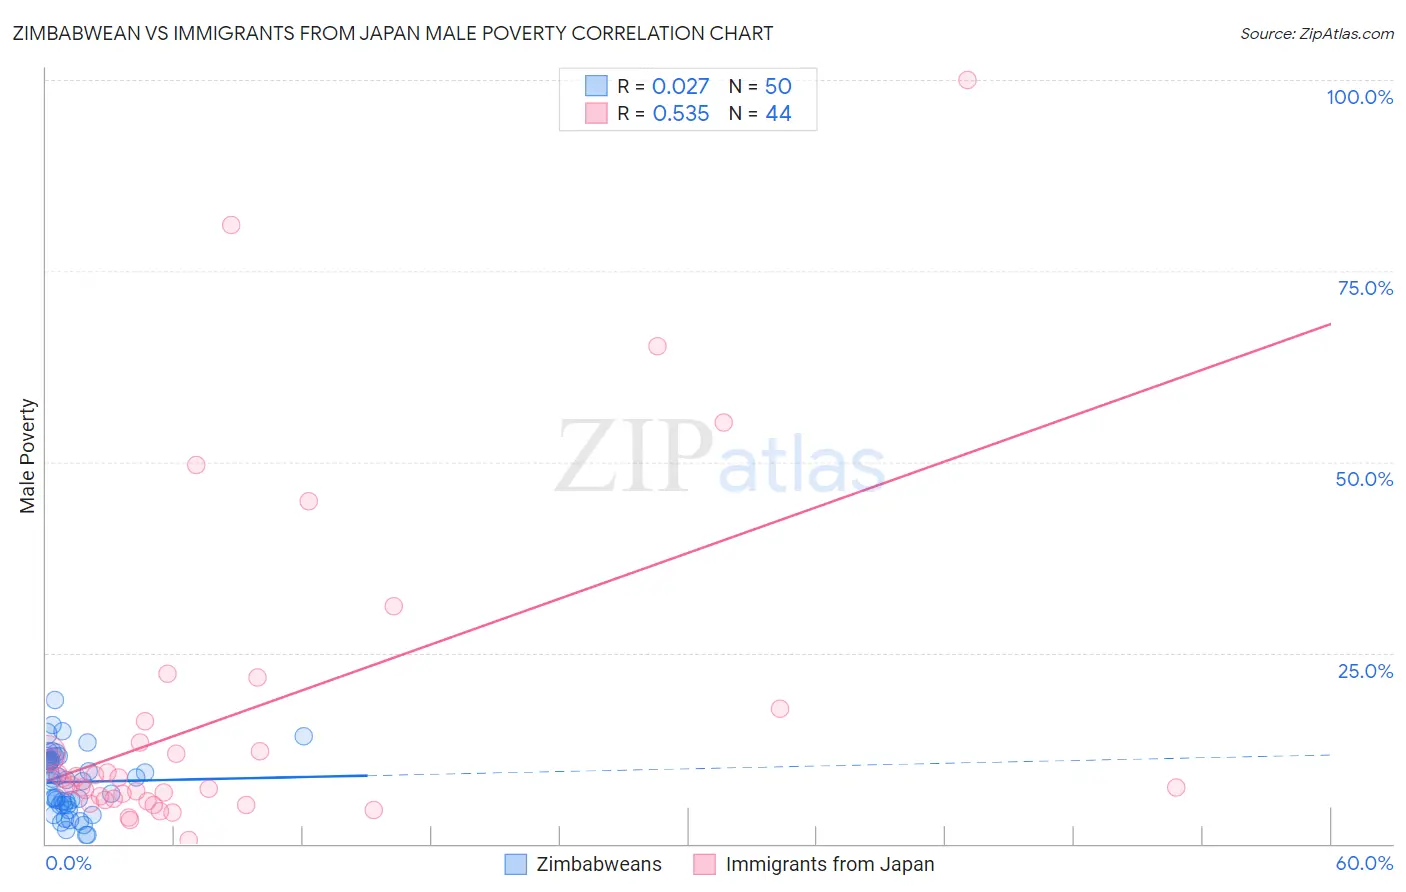
Zimbabwean vs Immigrants from Japan Male Poverty Correlation Chart
The statistical analysis conducted on geographies consisting of 69,180,294 people shows no correlation between the proportion of Zimbabweans and poverty level among males in the United States with a correlation coefficient (R) of 0.027 and weighted average of 10.2%. Similarly, the statistical analysis conducted on geographies consisting of 339,942,398 people shows a substantial positive correlation between the proportion of Immigrants from Japan and poverty level among males in the United States with a correlation coefficient (R) of 0.535 and weighted average of 10.0%, a difference of 2.1%.
Male Poverty Correlation Summary
| Measurement | Zimbabwean | Immigrants from Japan |
| Minimum | 1.2% | 0.45% |
| Maximum | 18.8% | 100.0% |
| Range | 17.7% | 99.6% |
| Mean | 8.1% | 16.8% |
| Median | 8.3% | 8.1% |
| Interquartile 25% (IQ1) | 5.1% | 5.8% |
| Interquartile 75% (IQ3) | 11.1% | 14.6% |
| Interquartile Range (IQR) | 5.9% | 8.8% |
| Standard Deviation (Sample) | 4.1% | 21.7% |
| Standard Deviation (Population) | 4.1% | 21.5% |
Demographics Similar to Zimbabweans and Immigrants from Japan by Male Poverty
In terms of male poverty, the demographic groups most similar to Zimbabweans are Serbian (10.2%, a difference of 0.010%), Swiss (10.2%, a difference of 0.070%), Slovak (10.2%, a difference of 0.30%), Immigrants from Italy (10.2%, a difference of 0.35%), and Austrian (10.1%, a difference of 0.44%). Similarly, the demographic groups most similar to Immigrants from Japan are Immigrants from Singapore (10.0%, a difference of 0.0%), Slovene (10.0%, a difference of 0.090%), Turkish (10.0%, a difference of 0.13%), Immigrants from Philippines (10.0%, a difference of 0.14%), and Immigrants from Croatia (10.0%, a difference of 0.25%).
| Demographics | Rating | Rank | Male Poverty |
| Turks | 98.9 /100 | #46 | Exceptional 10.0% |
| Immigrants | Singapore | 98.8 /100 | #47 | Exceptional 10.0% |
| Immigrants | Japan | 98.8 /100 | #48 | Exceptional 10.0% |
| Slovenes | 98.8 /100 | #49 | Exceptional 10.0% |
| Immigrants | Philippines | 98.7 /100 | #50 | Exceptional 10.0% |
| Immigrants | Croatia | 98.7 /100 | #51 | Exceptional 10.0% |
| Asians | 98.7 /100 | #52 | Exceptional 10.0% |
| Immigrants | Czechoslovakia | 98.6 /100 | #53 | Exceptional 10.0% |
| Immigrants | Austria | 98.5 /100 | #54 | Exceptional 10.0% |
| Germans | 98.3 /100 | #55 | Exceptional 10.1% |
| Immigrants | Bulgaria | 98.2 /100 | #56 | Exceptional 10.1% |
| Estonians | 98.1 /100 | #57 | Exceptional 10.1% |
| Scandinavians | 98.0 /100 | #58 | Exceptional 10.1% |
| Immigrants | Europe | 97.9 /100 | #59 | Exceptional 10.1% |
| Ukrainians | 97.9 /100 | #60 | Exceptional 10.1% |
| Austrians | 97.8 /100 | #61 | Exceptional 10.1% |
| Immigrants | Italy | 97.8 /100 | #62 | Exceptional 10.2% |
| Slovaks | 97.7 /100 | #63 | Exceptional 10.2% |
| Swiss | 97.5 /100 | #64 | Exceptional 10.2% |
| Zimbabweans | 97.5 /100 | #65 | Exceptional 10.2% |
| Serbians | 97.5 /100 | #66 | Exceptional 10.2% |