Zimbabwean vs Cree Male Poverty
COMPARE
Zimbabwean
Cree
Male Poverty
Male Poverty Comparison
Zimbabweans
Cree
10.2%
MALE POVERTY
97.5/ 100
METRIC RATING
65th/ 347
METRIC RANK
13.3%
MALE POVERTY
0.0/ 100
METRIC RATING
270th/ 347
METRIC RANK
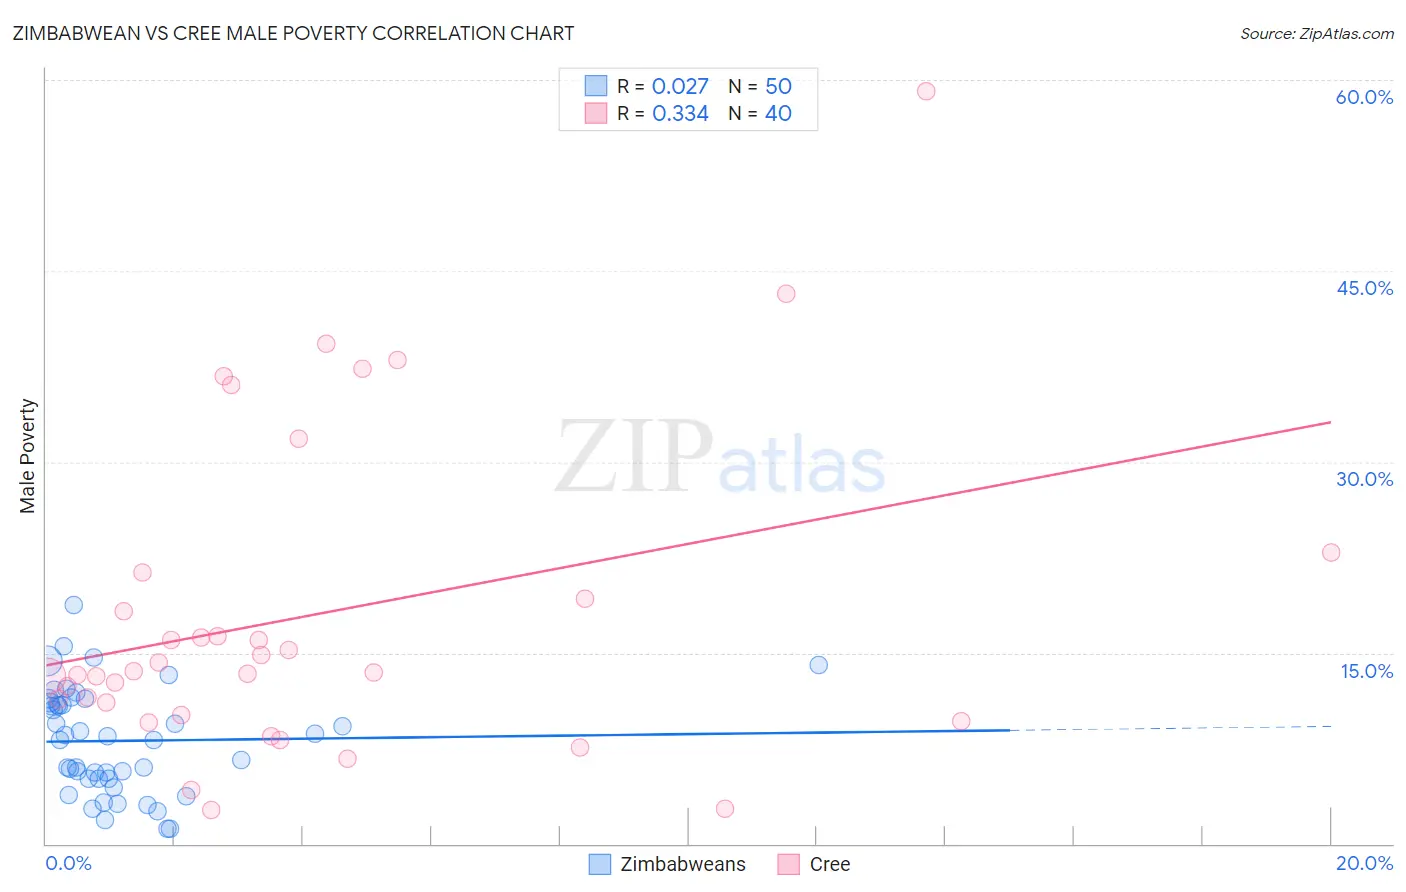
Zimbabwean vs Cree Male Poverty Correlation Chart
The statistical analysis conducted on geographies consisting of 69,180,294 people shows no correlation between the proportion of Zimbabweans and poverty level among males in the United States with a correlation coefficient (R) of 0.027 and weighted average of 10.2%. Similarly, the statistical analysis conducted on geographies consisting of 76,204,291 people shows a mild positive correlation between the proportion of Cree and poverty level among males in the United States with a correlation coefficient (R) of 0.334 and weighted average of 13.3%, a difference of 31.0%.
Male Poverty Correlation Summary
| Measurement | Zimbabwean | Cree |
| Minimum | 1.2% | 2.7% |
| Maximum | 18.8% | 59.1% |
| Range | 17.7% | 56.4% |
| Mean | 8.1% | 18.0% |
| Median | 8.3% | 13.5% |
| Interquartile 25% (IQ1) | 5.1% | 10.6% |
| Interquartile 75% (IQ3) | 11.1% | 20.2% |
| Interquartile Range (IQR) | 5.9% | 9.6% |
| Standard Deviation (Sample) | 4.1% | 12.5% |
| Standard Deviation (Population) | 4.1% | 12.4% |
Similar Demographics by Male Poverty
Demographics Similar to Zimbabweans by Male Poverty
In terms of male poverty, the demographic groups most similar to Zimbabweans are Serbian (10.2%, a difference of 0.010%), Swiss (10.2%, a difference of 0.070%), Immigrants from Netherlands (10.2%, a difference of 0.18%), Immigrants from Sri Lanka (10.2%, a difference of 0.24%), and Slovak (10.2%, a difference of 0.30%).
| Demographics | Rating | Rank | Male Poverty |
| Scandinavians | 98.0 /100 | #58 | Exceptional 10.1% |
| Immigrants | Europe | 97.9 /100 | #59 | Exceptional 10.1% |
| Ukrainians | 97.9 /100 | #60 | Exceptional 10.1% |
| Austrians | 97.8 /100 | #61 | Exceptional 10.1% |
| Immigrants | Italy | 97.8 /100 | #62 | Exceptional 10.2% |
| Slovaks | 97.7 /100 | #63 | Exceptional 10.2% |
| Swiss | 97.5 /100 | #64 | Exceptional 10.2% |
| Zimbabweans | 97.5 /100 | #65 | Exceptional 10.2% |
| Serbians | 97.5 /100 | #66 | Exceptional 10.2% |
| Immigrants | Netherlands | 97.3 /100 | #67 | Exceptional 10.2% |
| Immigrants | Sri Lanka | 97.2 /100 | #68 | Exceptional 10.2% |
| Immigrants | Australia | 97.1 /100 | #69 | Exceptional 10.2% |
| Paraguayans | 97.1 /100 | #70 | Exceptional 10.2% |
| Europeans | 97.1 /100 | #71 | Exceptional 10.2% |
| Immigrants | Canada | 97.1 /100 | #72 | Exceptional 10.2% |
Demographics Similar to Cree by Male Poverty
In terms of male poverty, the demographic groups most similar to Cree are Spanish American (13.4%, a difference of 0.030%), Guyanese (13.3%, a difference of 0.47%), Subsaharan African (13.3%, a difference of 0.69%), Immigrants from Jamaica (13.3%, a difference of 0.72%), and Immigrants from Bahamas (13.5%, a difference of 0.78%).
| Demographics | Rating | Rank | Male Poverty |
| Central Americans | 0.1 /100 | #263 | Tragic 13.2% |
| Iroquois | 0.1 /100 | #264 | Tragic 13.2% |
| Jamaicans | 0.1 /100 | #265 | Tragic 13.2% |
| Immigrants | Guyana | 0.1 /100 | #266 | Tragic 13.2% |
| Immigrants | Jamaica | 0.1 /100 | #267 | Tragic 13.3% |
| Sub-Saharan Africans | 0.1 /100 | #268 | Tragic 13.3% |
| Guyanese | 0.0 /100 | #269 | Tragic 13.3% |
| Cree | 0.0 /100 | #270 | Tragic 13.3% |
| Spanish Americans | 0.0 /100 | #271 | Tragic 13.4% |
| Immigrants | Bahamas | 0.0 /100 | #272 | Tragic 13.5% |
| Chickasaw | 0.0 /100 | #273 | Tragic 13.5% |
| Immigrants | West Indies | 0.0 /100 | #274 | Tragic 13.5% |
| Barbadians | 0.0 /100 | #275 | Tragic 13.6% |
| Immigrants | Latin America | 0.0 /100 | #276 | Tragic 13.6% |
| Bangladeshis | 0.0 /100 | #277 | Tragic 13.6% |