Zimbabwean vs Osage Male Poverty
COMPARE
Zimbabwean
Osage
Male Poverty
Male Poverty Comparison
Zimbabweans
Osage
10.2%
MALE POVERTY
97.5/ 100
METRIC RATING
65th/ 347
METRIC RANK
12.3%
MALE POVERTY
1.5/ 100
METRIC RATING
225th/ 347
METRIC RANK
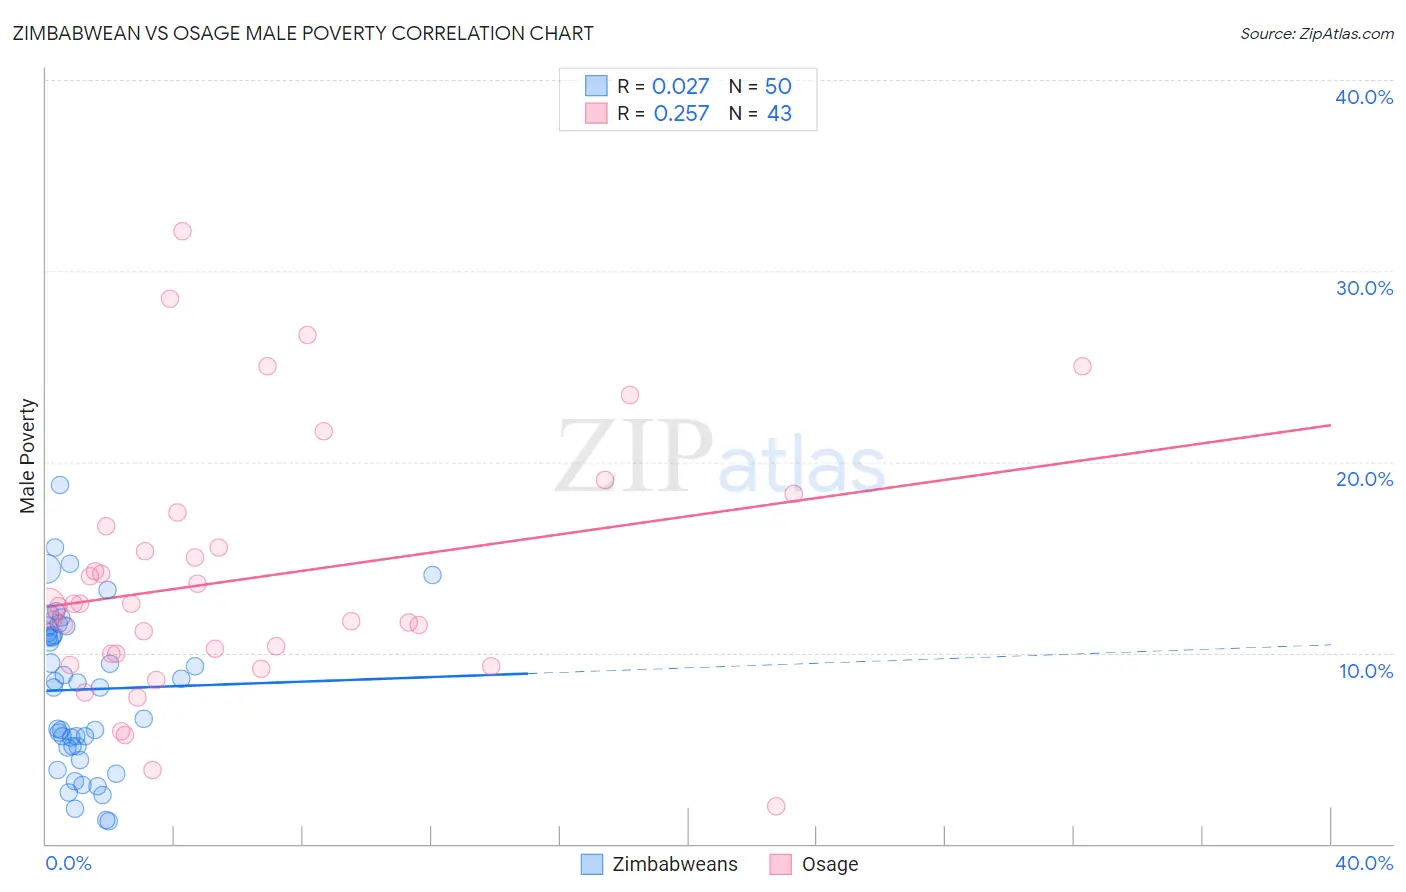
Zimbabwean vs Osage Male Poverty Correlation Chart
The statistical analysis conducted on geographies consisting of 69,180,294 people shows no correlation between the proportion of Zimbabweans and poverty level among males in the United States with a correlation coefficient (R) of 0.027 and weighted average of 10.2%. Similarly, the statistical analysis conducted on geographies consisting of 91,789,808 people shows a weak positive correlation between the proportion of Osage and poverty level among males in the United States with a correlation coefficient (R) of 0.257 and weighted average of 12.3%, a difference of 21.0%.
Male Poverty Correlation Summary
| Measurement | Zimbabwean | Osage |
| Minimum | 1.2% | 1.9% |
| Maximum | 18.8% | 32.1% |
| Range | 17.7% | 30.2% |
| Mean | 8.1% | 13.9% |
| Median | 8.3% | 12.4% |
| Interquartile 25% (IQ1) | 5.1% | 9.9% |
| Interquartile 75% (IQ3) | 11.1% | 16.6% |
| Interquartile Range (IQR) | 5.9% | 6.7% |
| Standard Deviation (Sample) | 4.1% | 6.6% |
| Standard Deviation (Population) | 4.1% | 6.5% |
Similar Demographics by Male Poverty
Demographics Similar to Zimbabweans by Male Poverty
In terms of male poverty, the demographic groups most similar to Zimbabweans are Serbian (10.2%, a difference of 0.010%), Swiss (10.2%, a difference of 0.070%), Immigrants from Netherlands (10.2%, a difference of 0.18%), Immigrants from Sri Lanka (10.2%, a difference of 0.24%), and Slovak (10.2%, a difference of 0.30%).
| Demographics | Rating | Rank | Male Poverty |
| Scandinavians | 98.0 /100 | #58 | Exceptional 10.1% |
| Immigrants | Europe | 97.9 /100 | #59 | Exceptional 10.1% |
| Ukrainians | 97.9 /100 | #60 | Exceptional 10.1% |
| Austrians | 97.8 /100 | #61 | Exceptional 10.1% |
| Immigrants | Italy | 97.8 /100 | #62 | Exceptional 10.2% |
| Slovaks | 97.7 /100 | #63 | Exceptional 10.2% |
| Swiss | 97.5 /100 | #64 | Exceptional 10.2% |
| Zimbabweans | 97.5 /100 | #65 | Exceptional 10.2% |
| Serbians | 97.5 /100 | #66 | Exceptional 10.2% |
| Immigrants | Netherlands | 97.3 /100 | #67 | Exceptional 10.2% |
| Immigrants | Sri Lanka | 97.2 /100 | #68 | Exceptional 10.2% |
| Immigrants | Australia | 97.1 /100 | #69 | Exceptional 10.2% |
| Paraguayans | 97.1 /100 | #70 | Exceptional 10.2% |
| Europeans | 97.1 /100 | #71 | Exceptional 10.2% |
| Immigrants | Canada | 97.1 /100 | #72 | Exceptional 10.2% |
Demographics Similar to Osage by Male Poverty
In terms of male poverty, the demographic groups most similar to Osage are Immigrants from Nigeria (12.3%, a difference of 0.060%), Nigerian (12.3%, a difference of 0.17%), Alaska Native (12.4%, a difference of 0.26%), Alsatian (12.4%, a difference of 0.30%), and Cuban (12.4%, a difference of 0.39%).
| Demographics | Rating | Rank | Male Poverty |
| German Russians | 2.5 /100 | #218 | Tragic 12.2% |
| Bermudans | 2.4 /100 | #219 | Tragic 12.2% |
| Immigrants | Eritrea | 2.4 /100 | #220 | Tragic 12.2% |
| Ugandans | 2.2 /100 | #221 | Tragic 12.2% |
| Immigrants | Africa | 2.1 /100 | #222 | Tragic 12.2% |
| Immigrants | Micronesia | 2.1 /100 | #223 | Tragic 12.2% |
| Immigrants | Nigeria | 1.6 /100 | #224 | Tragic 12.3% |
| Osage | 1.5 /100 | #225 | Tragic 12.3% |
| Nigerians | 1.4 /100 | #226 | Tragic 12.3% |
| Alaska Natives | 1.4 /100 | #227 | Tragic 12.4% |
| Alsatians | 1.3 /100 | #228 | Tragic 12.4% |
| Cubans | 1.3 /100 | #229 | Tragic 12.4% |
| Marshallese | 0.8 /100 | #230 | Tragic 12.5% |
| Salvadorans | 0.6 /100 | #231 | Tragic 12.6% |
| Nicaraguans | 0.6 /100 | #232 | Tragic 12.6% |