Zimbabwean vs Dutch Male Poverty
COMPARE
Zimbabwean
Dutch
Male Poverty
Male Poverty Comparison
Zimbabweans
Dutch
10.2%
MALE POVERTY
97.5/ 100
METRIC RATING
65th/ 347
METRIC RANK
10.2%
MALE POVERTY
96.9/ 100
METRIC RATING
76th/ 347
METRIC RANK
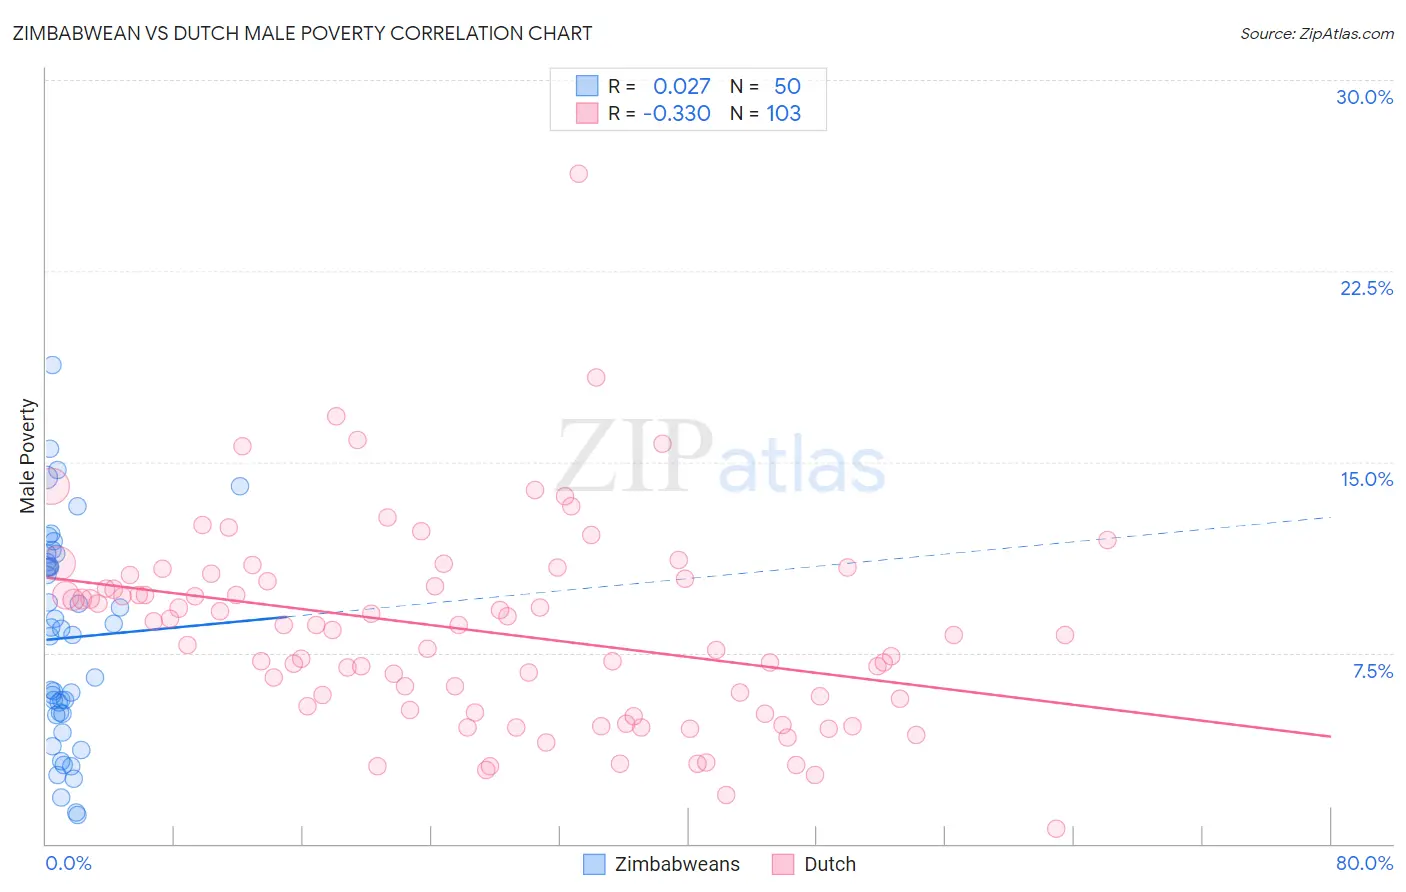
Zimbabwean vs Dutch Male Poverty Correlation Chart
The statistical analysis conducted on geographies consisting of 69,180,294 people shows no correlation between the proportion of Zimbabweans and poverty level among males in the United States with a correlation coefficient (R) of 0.027 and weighted average of 10.2%. Similarly, the statistical analysis conducted on geographies consisting of 553,017,798 people shows a mild negative correlation between the proportion of Dutch and poverty level among males in the United States with a correlation coefficient (R) of -0.330 and weighted average of 10.2%, a difference of 0.59%.
Male Poverty Correlation Summary
| Measurement | Zimbabwean | Dutch |
| Minimum | 1.2% | 0.58% |
| Maximum | 18.8% | 26.3% |
| Range | 17.7% | 25.7% |
| Mean | 8.1% | 8.4% |
| Median | 8.3% | 8.4% |
| Interquartile 25% (IQ1) | 5.1% | 5.3% |
| Interquartile 75% (IQ3) | 11.1% | 10.4% |
| Interquartile Range (IQR) | 5.9% | 5.1% |
| Standard Deviation (Sample) | 4.1% | 3.9% |
| Standard Deviation (Population) | 4.1% | 3.9% |
Demographics Similar to Zimbabweans and Dutch by Male Poverty
In terms of male poverty, the demographic groups most similar to Zimbabweans are Serbian (10.2%, a difference of 0.010%), Swiss (10.2%, a difference of 0.070%), Immigrants from Netherlands (10.2%, a difference of 0.18%), Immigrants from Sri Lanka (10.2%, a difference of 0.24%), and Slovak (10.2%, a difference of 0.30%). Similarly, the demographic groups most similar to Dutch are Immigrants from Eastern Europe (10.2%, a difference of 0.010%), Carpatho Rusyn (10.2%, a difference of 0.010%), Immigrants from Belgium (10.3%, a difference of 0.030%), Irish (10.3%, a difference of 0.050%), and Immigrants from Asia (10.2%, a difference of 0.080%).
| Demographics | Rating | Rank | Male Poverty |
| Ukrainians | 97.9 /100 | #60 | Exceptional 10.1% |
| Austrians | 97.8 /100 | #61 | Exceptional 10.1% |
| Immigrants | Italy | 97.8 /100 | #62 | Exceptional 10.2% |
| Slovaks | 97.7 /100 | #63 | Exceptional 10.2% |
| Swiss | 97.5 /100 | #64 | Exceptional 10.2% |
| Zimbabweans | 97.5 /100 | #65 | Exceptional 10.2% |
| Serbians | 97.5 /100 | #66 | Exceptional 10.2% |
| Immigrants | Netherlands | 97.3 /100 | #67 | Exceptional 10.2% |
| Immigrants | Sri Lanka | 97.2 /100 | #68 | Exceptional 10.2% |
| Immigrants | Australia | 97.1 /100 | #69 | Exceptional 10.2% |
| Paraguayans | 97.1 /100 | #70 | Exceptional 10.2% |
| Europeans | 97.1 /100 | #71 | Exceptional 10.2% |
| Immigrants | Canada | 97.1 /100 | #72 | Exceptional 10.2% |
| Immigrants | Asia | 97.0 /100 | #73 | Exceptional 10.2% |
| Immigrants | Eastern Europe | 96.9 /100 | #74 | Exceptional 10.2% |
| Carpatho Rusyns | 96.9 /100 | #75 | Exceptional 10.2% |
| Dutch | 96.9 /100 | #76 | Exceptional 10.2% |
| Immigrants | Belgium | 96.8 /100 | #77 | Exceptional 10.3% |
| Irish | 96.8 /100 | #78 | Exceptional 10.3% |
| Immigrants | North America | 96.5 /100 | #79 | Exceptional 10.3% |
| English | 96.4 /100 | #80 | Exceptional 10.3% |