Immigrants from Grenada vs Hopi Male Poverty
COMPARE
Immigrants from Grenada
Hopi
Male Poverty
Male Poverty Comparison
Immigrants from Grenada
Hopi
14.7%
MALE POVERTY
0.0/ 100
METRIC RATING
318th/ 347
METRIC RANK
20.8%
MALE POVERTY
0.0/ 100
METRIC RATING
344th/ 347
METRIC RANK
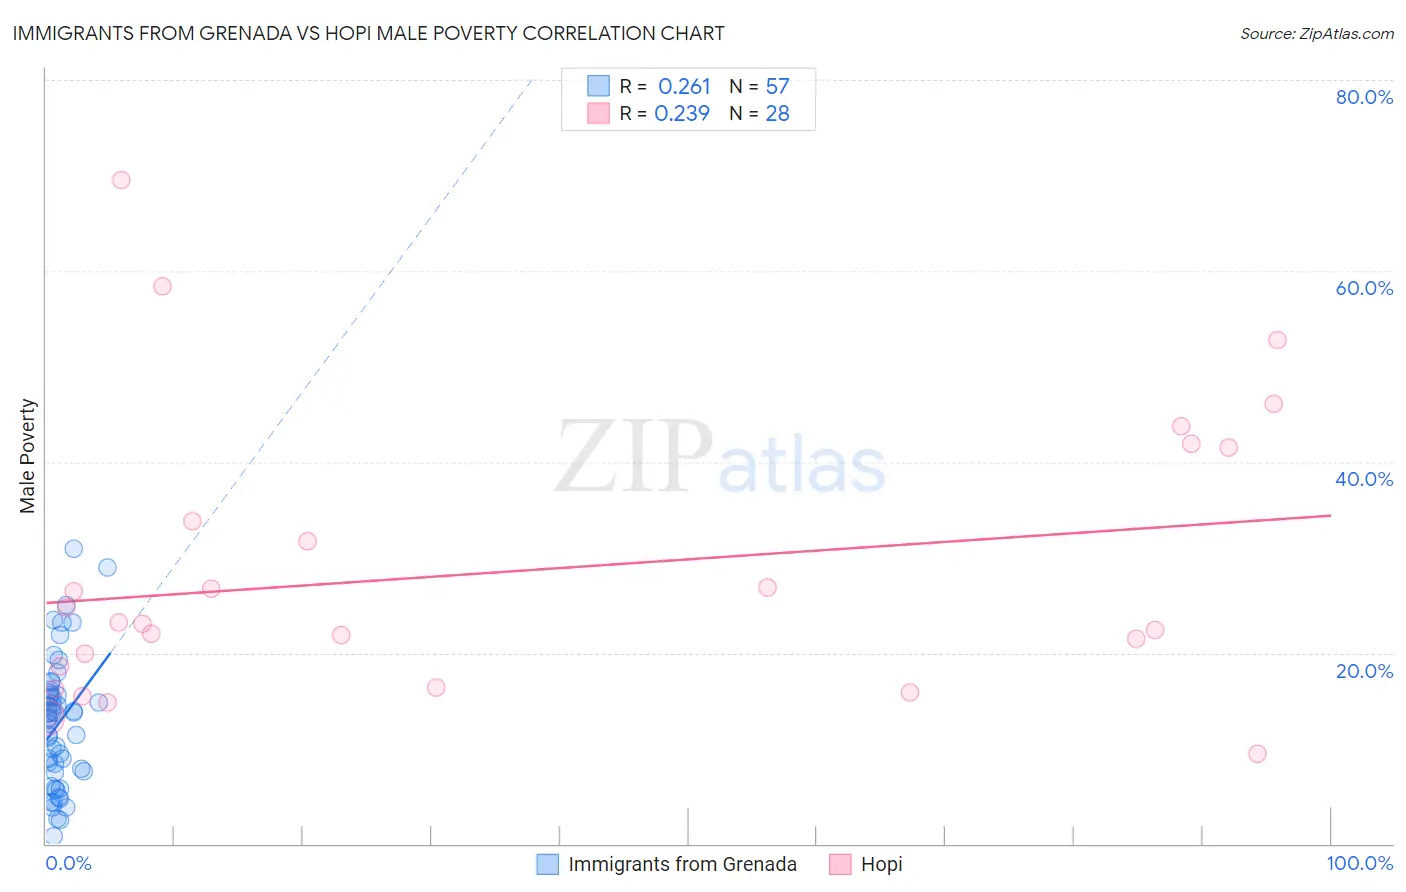
Immigrants from Grenada vs Hopi Male Poverty Correlation Chart
The statistical analysis conducted on geographies consisting of 67,181,242 people shows a weak positive correlation between the proportion of Immigrants from Grenada and poverty level among males in the United States with a correlation coefficient (R) of 0.261 and weighted average of 14.7%. Similarly, the statistical analysis conducted on geographies consisting of 74,731,622 people shows a weak positive correlation between the proportion of Hopi and poverty level among males in the United States with a correlation coefficient (R) of 0.239 and weighted average of 20.8%, a difference of 41.5%.
Male Poverty Correlation Summary
| Measurement | Immigrants from Grenada | Hopi |
| Minimum | 0.80% | 9.5% |
| Maximum | 30.9% | 69.5% |
| Range | 30.1% | 60.0% |
| Mean | 12.6% | 28.5% |
| Median | 13.2% | 23.1% |
| Interquartile 25% (IQ1) | 7.5% | 17.4% |
| Interquartile 75% (IQ3) | 15.6% | 37.7% |
| Interquartile Range (IQR) | 8.1% | 20.2% |
| Standard Deviation (Sample) | 6.7% | 14.8% |
| Standard Deviation (Population) | 6.7% | 14.6% |
Similar Demographics by Male Poverty
Demographics Similar to Immigrants from Grenada by Male Poverty
In terms of male poverty, the demographic groups most similar to Immigrants from Grenada are U.S. Virgin Islander (14.7%, a difference of 0.030%), Immigrants from Dominica (14.7%, a difference of 0.060%), Immigrants from Congo (14.7%, a difference of 0.12%), British West Indian (14.6%, a difference of 0.74%), and Chippewa (14.6%, a difference of 0.76%).
| Demographics | Rating | Rank | Male Poverty |
| Hondurans | 0.0 /100 | #311 | Tragic 14.3% |
| Choctaw | 0.0 /100 | #312 | Tragic 14.4% |
| Immigrants | Somalia | 0.0 /100 | #313 | Tragic 14.6% |
| Immigrants | Honduras | 0.0 /100 | #314 | Tragic 14.6% |
| Chippewa | 0.0 /100 | #315 | Tragic 14.6% |
| British West Indians | 0.0 /100 | #316 | Tragic 14.6% |
| Immigrants | Dominica | 0.0 /100 | #317 | Tragic 14.7% |
| Immigrants | Grenada | 0.0 /100 | #318 | Tragic 14.7% |
| U.S. Virgin Islanders | 0.0 /100 | #319 | Tragic 14.7% |
| Immigrants | Congo | 0.0 /100 | #320 | Tragic 14.7% |
| Arapaho | 0.0 /100 | #321 | Tragic 15.1% |
| Kiowa | 0.0 /100 | #322 | Tragic 15.2% |
| Colville | 0.0 /100 | #323 | Tragic 15.2% |
| Menominee | 0.0 /100 | #324 | Tragic 15.3% |
| Yakama | 0.0 /100 | #325 | Tragic 15.3% |
Demographics Similar to Hopi by Male Poverty
In terms of male poverty, the demographic groups most similar to Hopi are Yup'ik (20.4%, a difference of 2.1%), Pima (20.4%, a difference of 2.2%), Lumbee (20.2%, a difference of 3.0%), Immigrants from Yemen (20.1%, a difference of 3.3%), and Puerto Rican (22.0%, a difference of 5.9%).
| Demographics | Rating | Rank | Male Poverty |
| Natives/Alaskans | 0.0 /100 | #333 | Tragic 16.9% |
| Cheyenne | 0.0 /100 | #334 | Tragic 17.6% |
| Apache | 0.0 /100 | #335 | Tragic 17.7% |
| Pueblo | 0.0 /100 | #336 | Tragic 18.5% |
| Sioux | 0.0 /100 | #337 | Tragic 18.7% |
| Crow | 0.0 /100 | #338 | Tragic 19.1% |
| Yuman | 0.0 /100 | #339 | Tragic 19.5% |
| Immigrants | Yemen | 0.0 /100 | #340 | Tragic 20.1% |
| Lumbee | 0.0 /100 | #341 | Tragic 20.2% |
| Pima | 0.0 /100 | #342 | Tragic 20.4% |
| Yup'ik | 0.0 /100 | #343 | Tragic 20.4% |
| Hopi | 0.0 /100 | #344 | Tragic 20.8% |
| Puerto Ricans | 0.0 /100 | #345 | Tragic 22.0% |
| Navajo | 0.0 /100 | #346 | Tragic 22.3% |
| Tohono O'odham | 0.0 /100 | #347 | Tragic 22.9% |