Zimbabwean vs Hopi Hearing Disability
COMPARE
Zimbabwean
Hopi
Hearing Disability
Hearing Disability Comparison
Zimbabweans
Hopi
2.8%
HEARING DISABILITY
89.9/ 100
METRIC RATING
118th/ 347
METRIC RANK
3.9%
HEARING DISABILITY
0.0/ 100
METRIC RATING
313th/ 347
METRIC RANK
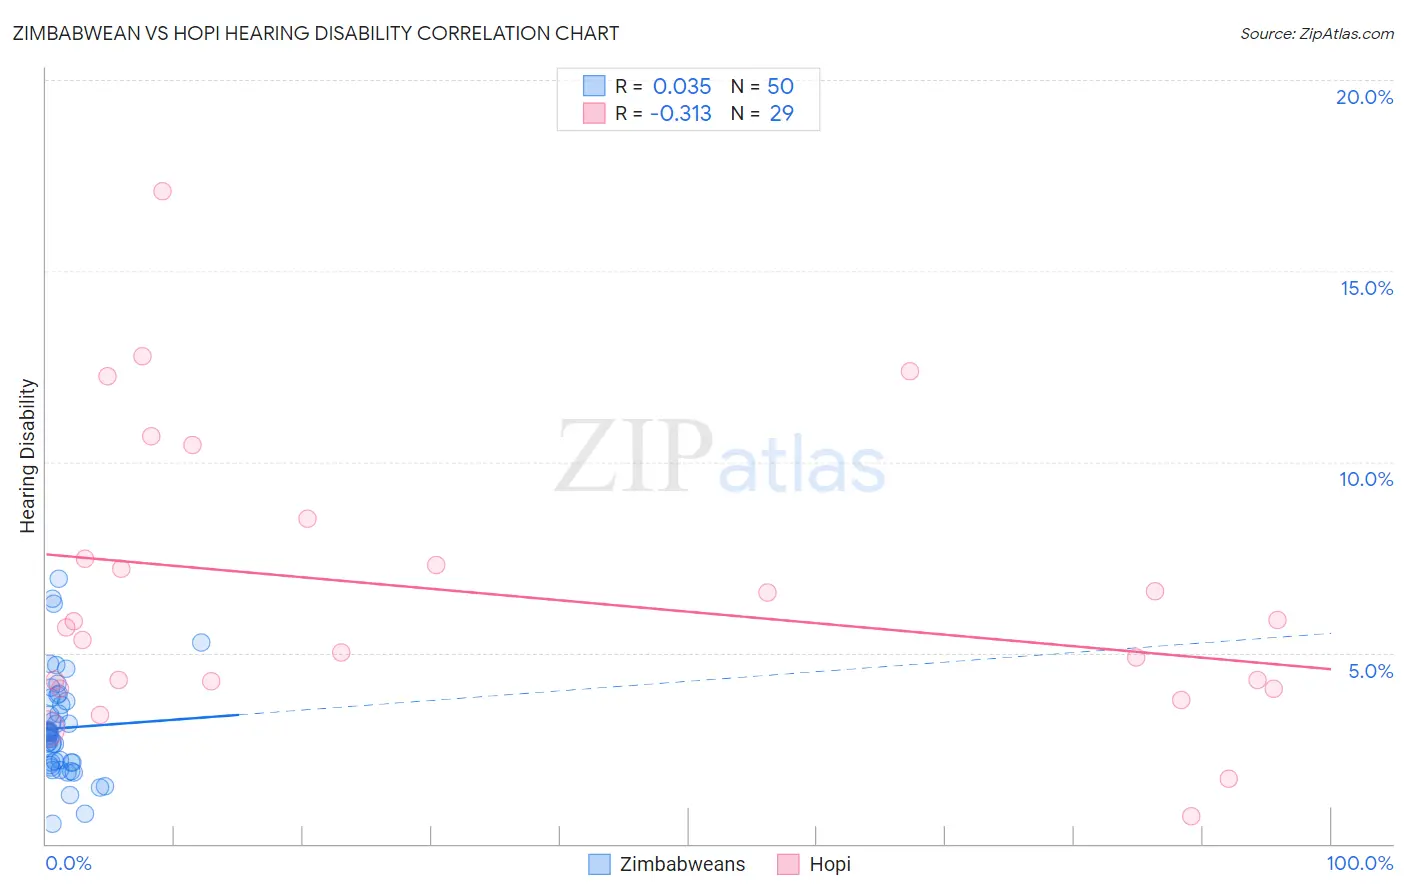
Zimbabwean vs Hopi Hearing Disability Correlation Chart
The statistical analysis conducted on geographies consisting of 69,200,821 people shows no correlation between the proportion of Zimbabweans and percentage of population with hearing disability in the United States with a correlation coefficient (R) of 0.035 and weighted average of 2.8%. Similarly, the statistical analysis conducted on geographies consisting of 74,726,897 people shows a mild negative correlation between the proportion of Hopi and percentage of population with hearing disability in the United States with a correlation coefficient (R) of -0.313 and weighted average of 3.9%, a difference of 38.7%.
Hearing Disability Correlation Summary
| Measurement | Zimbabwean | Hopi |
| Minimum | 0.53% | 0.73% |
| Maximum | 6.9% | 17.1% |
| Range | 6.4% | 16.3% |
| Mean | 3.0% | 6.5% |
| Median | 2.9% | 5.7% |
| Interquartile 25% (IQ1) | 2.1% | 4.2% |
| Interquartile 75% (IQ3) | 3.7% | 8.0% |
| Interquartile Range (IQR) | 1.6% | 3.8% |
| Standard Deviation (Sample) | 1.3% | 3.7% |
| Standard Deviation (Population) | 1.3% | 3.6% |
Similar Demographics by Hearing Disability
Demographics Similar to Zimbabweans by Hearing Disability
In terms of hearing disability, the demographic groups most similar to Zimbabweans are Immigrants from Liberia (2.8%, a difference of 0.010%), Kenyan (2.8%, a difference of 0.020%), Immigrants (2.8%, a difference of 0.10%), Jordanian (2.8%, a difference of 0.11%), and Cuban (2.8%, a difference of 0.14%).
| Demographics | Rating | Rank | Hearing Disability |
| Immigrants | Yemen | 92.7 /100 | #111 | Exceptional 2.8% |
| U.S. Virgin Islanders | 92.5 /100 | #112 | Exceptional 2.8% |
| Immigrants | Belarus | 91.6 /100 | #113 | Exceptional 2.8% |
| Cambodians | 91.1 /100 | #114 | Exceptional 2.8% |
| Immigrants | Latin America | 90.5 /100 | #115 | Exceptional 2.8% |
| Immigrants | Immigrants | 90.3 /100 | #116 | Exceptional 2.8% |
| Immigrants | Liberia | 90.0 /100 | #117 | Excellent 2.8% |
| Zimbabweans | 89.9 /100 | #118 | Excellent 2.8% |
| Kenyans | 89.8 /100 | #119 | Excellent 2.8% |
| Jordanians | 89.5 /100 | #120 | Excellent 2.8% |
| Cubans | 89.4 /100 | #121 | Excellent 2.8% |
| Liberians | 89.0 /100 | #122 | Excellent 2.8% |
| Immigrants | Zaire | 88.6 /100 | #123 | Excellent 2.9% |
| Bahamians | 88.6 /100 | #124 | Excellent 2.9% |
| Immigrants | Albania | 88.5 /100 | #125 | Excellent 2.9% |
Demographics Similar to Hopi by Hearing Disability
In terms of hearing disability, the demographic groups most similar to Hopi are Cajun (3.9%, a difference of 0.11%), Yakama (3.9%, a difference of 0.17%), Puget Sound Salish (3.9%, a difference of 0.18%), Spanish American (4.0%, a difference of 0.38%), and Comanche (4.0%, a difference of 0.51%).
| Demographics | Rating | Rank | Hearing Disability |
| Marshallese | 0.0 /100 | #306 | Tragic 3.8% |
| French Canadians | 0.0 /100 | #307 | Tragic 3.8% |
| Ottawa | 0.0 /100 | #308 | Tragic 3.8% |
| Scotch-Irish | 0.0 /100 | #309 | Tragic 3.8% |
| Cree | 0.0 /100 | #310 | Tragic 3.8% |
| Americans | 0.0 /100 | #311 | Tragic 3.9% |
| Cajuns | 0.0 /100 | #312 | Tragic 3.9% |
| Hopi | 0.0 /100 | #313 | Tragic 3.9% |
| Yakama | 0.0 /100 | #314 | Tragic 3.9% |
| Puget Sound Salish | 0.0 /100 | #315 | Tragic 3.9% |
| Spanish Americans | 0.0 /100 | #316 | Tragic 4.0% |
| Comanche | 0.0 /100 | #317 | Tragic 4.0% |
| Cheyenne | 0.0 /100 | #318 | Tragic 4.0% |
| Chippewa | 0.0 /100 | #319 | Tragic 4.0% |
| Shoshone | 0.0 /100 | #320 | Tragic 4.0% |