Zimbabwean vs Filipino Male Poverty
COMPARE
Zimbabwean
Filipino
Male Poverty
Male Poverty Comparison
Zimbabweans
Filipinos
10.2%
MALE POVERTY
97.5/ 100
METRIC RATING
65th/ 347
METRIC RANK
9.2%
MALE POVERTY
99.9/ 100
METRIC RATING
8th/ 347
METRIC RANK
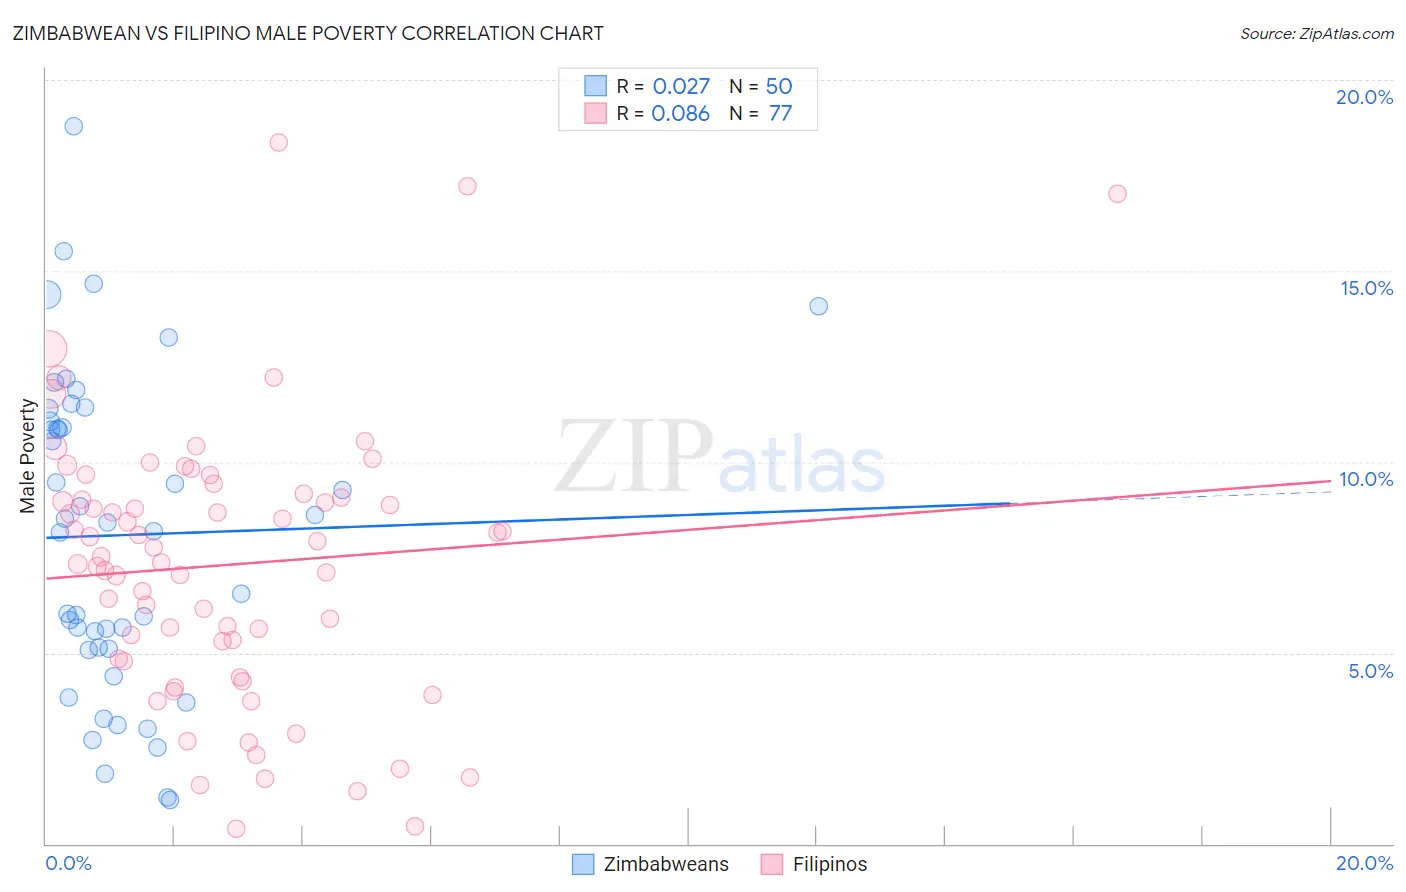
Zimbabwean vs Filipino Male Poverty Correlation Chart
The statistical analysis conducted on geographies consisting of 69,180,294 people shows no correlation between the proportion of Zimbabweans and poverty level among males in the United States with a correlation coefficient (R) of 0.027 and weighted average of 10.2%. Similarly, the statistical analysis conducted on geographies consisting of 254,097,817 people shows a slight positive correlation between the proportion of Filipinos and poverty level among males in the United States with a correlation coefficient (R) of 0.086 and weighted average of 9.2%, a difference of 10.7%.
Male Poverty Correlation Summary
| Measurement | Zimbabwean | Filipino |
| Minimum | 1.2% | 0.38% |
| Maximum | 18.8% | 18.4% |
| Range | 17.7% | 18.0% |
| Mean | 8.1% | 7.3% |
| Median | 8.3% | 7.5% |
| Interquartile 25% (IQ1) | 5.1% | 4.8% |
| Interquartile 75% (IQ3) | 11.1% | 9.1% |
| Interquartile Range (IQR) | 5.9% | 4.3% |
| Standard Deviation (Sample) | 4.1% | 3.6% |
| Standard Deviation (Population) | 4.1% | 3.6% |
Similar Demographics by Male Poverty
Demographics Similar to Zimbabweans by Male Poverty
In terms of male poverty, the demographic groups most similar to Zimbabweans are Serbian (10.2%, a difference of 0.010%), Swiss (10.2%, a difference of 0.070%), Immigrants from Netherlands (10.2%, a difference of 0.18%), Immigrants from Sri Lanka (10.2%, a difference of 0.24%), and Slovak (10.2%, a difference of 0.30%).
| Demographics | Rating | Rank | Male Poverty |
| Scandinavians | 98.0 /100 | #58 | Exceptional 10.1% |
| Immigrants | Europe | 97.9 /100 | #59 | Exceptional 10.1% |
| Ukrainians | 97.9 /100 | #60 | Exceptional 10.1% |
| Austrians | 97.8 /100 | #61 | Exceptional 10.1% |
| Immigrants | Italy | 97.8 /100 | #62 | Exceptional 10.2% |
| Slovaks | 97.7 /100 | #63 | Exceptional 10.2% |
| Swiss | 97.5 /100 | #64 | Exceptional 10.2% |
| Zimbabweans | 97.5 /100 | #65 | Exceptional 10.2% |
| Serbians | 97.5 /100 | #66 | Exceptional 10.2% |
| Immigrants | Netherlands | 97.3 /100 | #67 | Exceptional 10.2% |
| Immigrants | Sri Lanka | 97.2 /100 | #68 | Exceptional 10.2% |
| Immigrants | Australia | 97.1 /100 | #69 | Exceptional 10.2% |
| Paraguayans | 97.1 /100 | #70 | Exceptional 10.2% |
| Europeans | 97.1 /100 | #71 | Exceptional 10.2% |
| Immigrants | Canada | 97.1 /100 | #72 | Exceptional 10.2% |
Demographics Similar to Filipinos by Male Poverty
In terms of male poverty, the demographic groups most similar to Filipinos are Immigrants from Ireland (9.1%, a difference of 0.67%), Assyrian/Chaldean/Syriac (9.1%, a difference of 0.75%), Immigrants from South Central Asia (9.3%, a difference of 0.79%), Bulgarian (9.3%, a difference of 1.4%), and Maltese (9.1%, a difference of 1.4%).
| Demographics | Rating | Rank | Male Poverty |
| Immigrants | India | 100.0 /100 | #1 | Exceptional 8.2% |
| Chinese | 100.0 /100 | #2 | Exceptional 8.7% |
| Thais | 100.0 /100 | #3 | Exceptional 8.7% |
| Immigrants | Taiwan | 100.0 /100 | #4 | Exceptional 8.9% |
| Maltese | 100.0 /100 | #5 | Exceptional 9.1% |
| Assyrians/Chaldeans/Syriacs | 99.9 /100 | #6 | Exceptional 9.1% |
| Immigrants | Ireland | 99.9 /100 | #7 | Exceptional 9.1% |
| Filipinos | 99.9 /100 | #8 | Exceptional 9.2% |
| Immigrants | South Central Asia | 99.9 /100 | #9 | Exceptional 9.3% |
| Bulgarians | 99.9 /100 | #10 | Exceptional 9.3% |
| Bolivians | 99.9 /100 | #11 | Exceptional 9.4% |
| Immigrants | Bolivia | 99.9 /100 | #12 | Exceptional 9.4% |
| Immigrants | Lithuania | 99.9 /100 | #13 | Exceptional 9.4% |
| Immigrants | North Macedonia | 99.8 /100 | #14 | Exceptional 9.4% |
| Bhutanese | 99.8 /100 | #15 | Exceptional 9.5% |