Czech vs Cambodian Single Female Poverty
COMPARE
Czech
Cambodian
Single Female Poverty
Single Female Poverty Comparison
Czechs
Cambodians
21.0%
SINGLE FEMALE POVERTY
46.8/ 100
METRIC RATING
175th/ 347
METRIC RANK
19.2%
SINGLE FEMALE POVERTY
99.6/ 100
METRIC RATING
61st/ 347
METRIC RANK
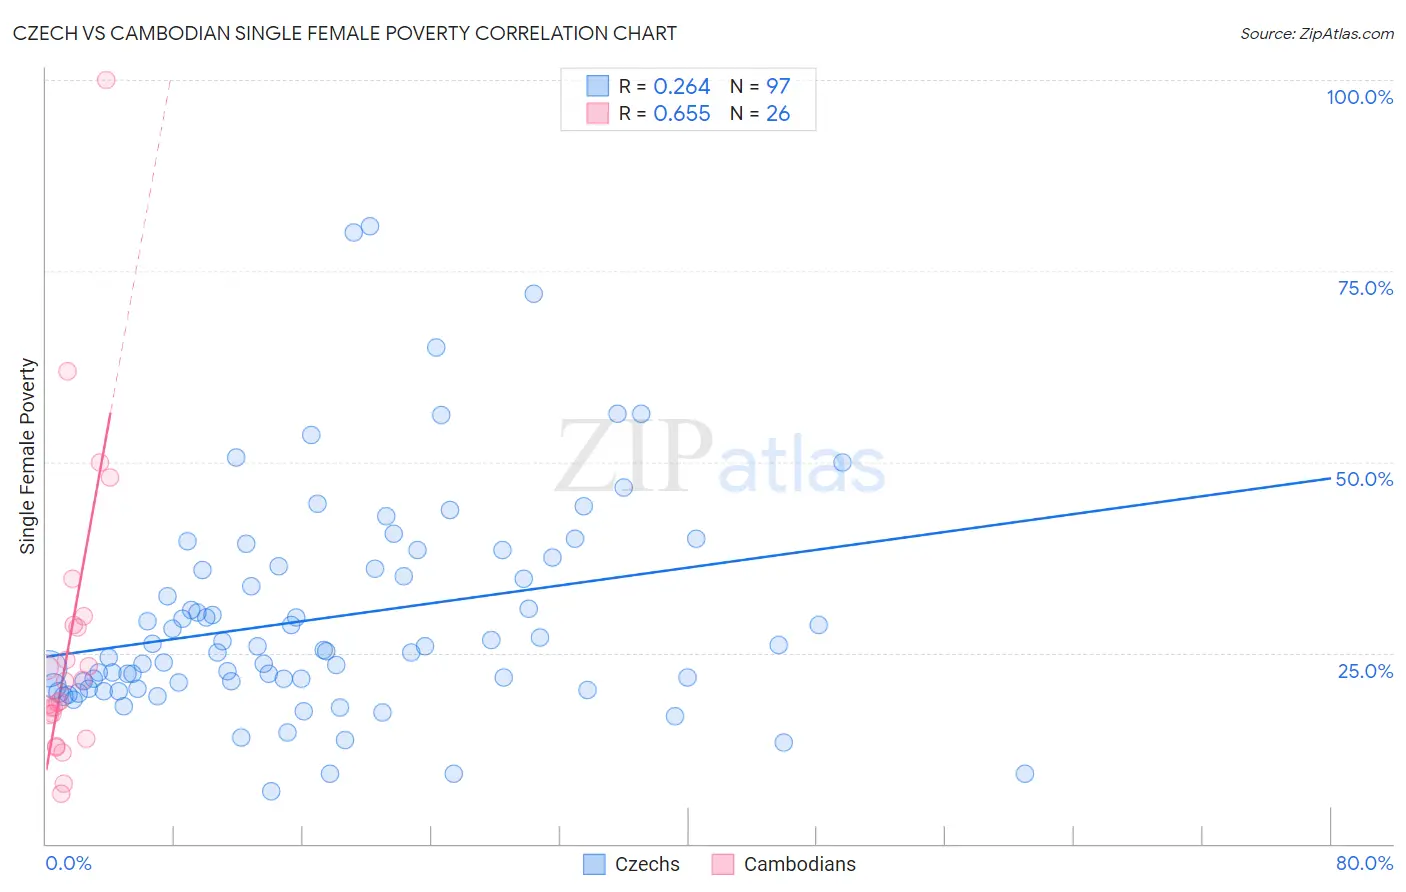
Czech vs Cambodian Single Female Poverty Correlation Chart
The statistical analysis conducted on geographies consisting of 472,282,128 people shows a weak positive correlation between the proportion of Czechs and poverty level among single females in the United States with a correlation coefficient (R) of 0.264 and weighted average of 21.0%. Similarly, the statistical analysis conducted on geographies consisting of 102,115,790 people shows a significant positive correlation between the proportion of Cambodians and poverty level among single females in the United States with a correlation coefficient (R) of 0.655 and weighted average of 19.2%, a difference of 9.7%.
Single Female Poverty Correlation Summary
| Measurement | Czech | Cambodian |
| Minimum | 6.8% | 6.6% |
| Maximum | 80.9% | 100.0% |
| Range | 74.1% | 93.4% |
| Mean | 29.6% | 26.3% |
| Median | 25.3% | 19.9% |
| Interquartile 25% (IQ1) | 20.5% | 17.0% |
| Interquartile 75% (IQ3) | 36.2% | 28.6% |
| Interquartile Range (IQR) | 15.7% | 11.6% |
| Standard Deviation (Sample) | 14.3% | 19.9% |
| Standard Deviation (Population) | 14.3% | 19.5% |
Similar Demographics by Single Female Poverty
Demographics Similar to Czechs by Single Female Poverty
In terms of single female poverty, the demographic groups most similar to Czechs are Canadian (21.1%, a difference of 0.080%), Scandinavian (21.1%, a difference of 0.10%), Immigrants from Bosnia and Herzegovina (21.1%, a difference of 0.12%), Cuban (21.0%, a difference of 0.20%), and Immigrants from Guyana (21.0%, a difference of 0.24%).
| Demographics | Rating | Rank | Single Female Poverty |
| Immigrants | Costa Rica | 61.5 /100 | #168 | Good 20.9% |
| Immigrants | Trinidad and Tobago | 56.3 /100 | #169 | Average 20.9% |
| New Zealanders | 53.2 /100 | #170 | Average 21.0% |
| Moroccans | 52.8 /100 | #171 | Average 21.0% |
| Guyanese | 52.0 /100 | #172 | Average 21.0% |
| Immigrants | Guyana | 50.6 /100 | #173 | Average 21.0% |
| Cubans | 50.0 /100 | #174 | Average 21.0% |
| Czechs | 46.8 /100 | #175 | Average 21.0% |
| Canadians | 45.4 /100 | #176 | Average 21.1% |
| Scandinavians | 45.2 /100 | #177 | Average 21.1% |
| Immigrants | Bosnia and Herzegovina | 44.9 /100 | #178 | Average 21.1% |
| British | 42.9 /100 | #179 | Average 21.1% |
| Spanish American Indians | 42.5 /100 | #180 | Average 21.1% |
| Europeans | 42.3 /100 | #181 | Average 21.1% |
| Slavs | 40.5 /100 | #182 | Average 21.1% |
Demographics Similar to Cambodians by Single Female Poverty
In terms of single female poverty, the demographic groups most similar to Cambodians are Russian (19.2%, a difference of 0.020%), Lithuanian (19.2%, a difference of 0.050%), Sri Lankan (19.2%, a difference of 0.12%), Immigrants from Northern Europe (19.2%, a difference of 0.17%), and Immigrants from Europe (19.2%, a difference of 0.18%).
| Demographics | Rating | Rank | Single Female Poverty |
| Argentineans | 99.7 /100 | #54 | Exceptional 19.1% |
| Immigrants | Vietnam | 99.7 /100 | #55 | Exceptional 19.1% |
| Immigrants | Fiji | 99.7 /100 | #56 | Exceptional 19.1% |
| Eastern Europeans | 99.7 /100 | #57 | Exceptional 19.1% |
| Immigrants | Bulgaria | 99.7 /100 | #58 | Exceptional 19.1% |
| Sri Lankans | 99.6 /100 | #59 | Exceptional 19.2% |
| Russians | 99.6 /100 | #60 | Exceptional 19.2% |
| Cambodians | 99.6 /100 | #61 | Exceptional 19.2% |
| Lithuanians | 99.6 /100 | #62 | Exceptional 19.2% |
| Immigrants | Northern Europe | 99.6 /100 | #63 | Exceptional 19.2% |
| Immigrants | Europe | 99.6 /100 | #64 | Exceptional 19.2% |
| Cypriots | 99.6 /100 | #65 | Exceptional 19.2% |
| Palestinians | 99.6 /100 | #66 | Exceptional 19.2% |
| Immigrants | Egypt | 99.6 /100 | #67 | Exceptional 19.2% |
| Laotians | 99.5 /100 | #68 | Exceptional 19.3% |