Immigrants from Caribbean vs Cambodian Single Female Poverty
COMPARE
Immigrants from Caribbean
Cambodian
Single Female Poverty
Single Female Poverty Comparison
Immigrants from Caribbean
Cambodians
22.4%
SINGLE FEMALE POVERTY
1.3/ 100
METRIC RATING
249th/ 347
METRIC RANK
19.2%
SINGLE FEMALE POVERTY
99.6/ 100
METRIC RATING
61st/ 347
METRIC RANK
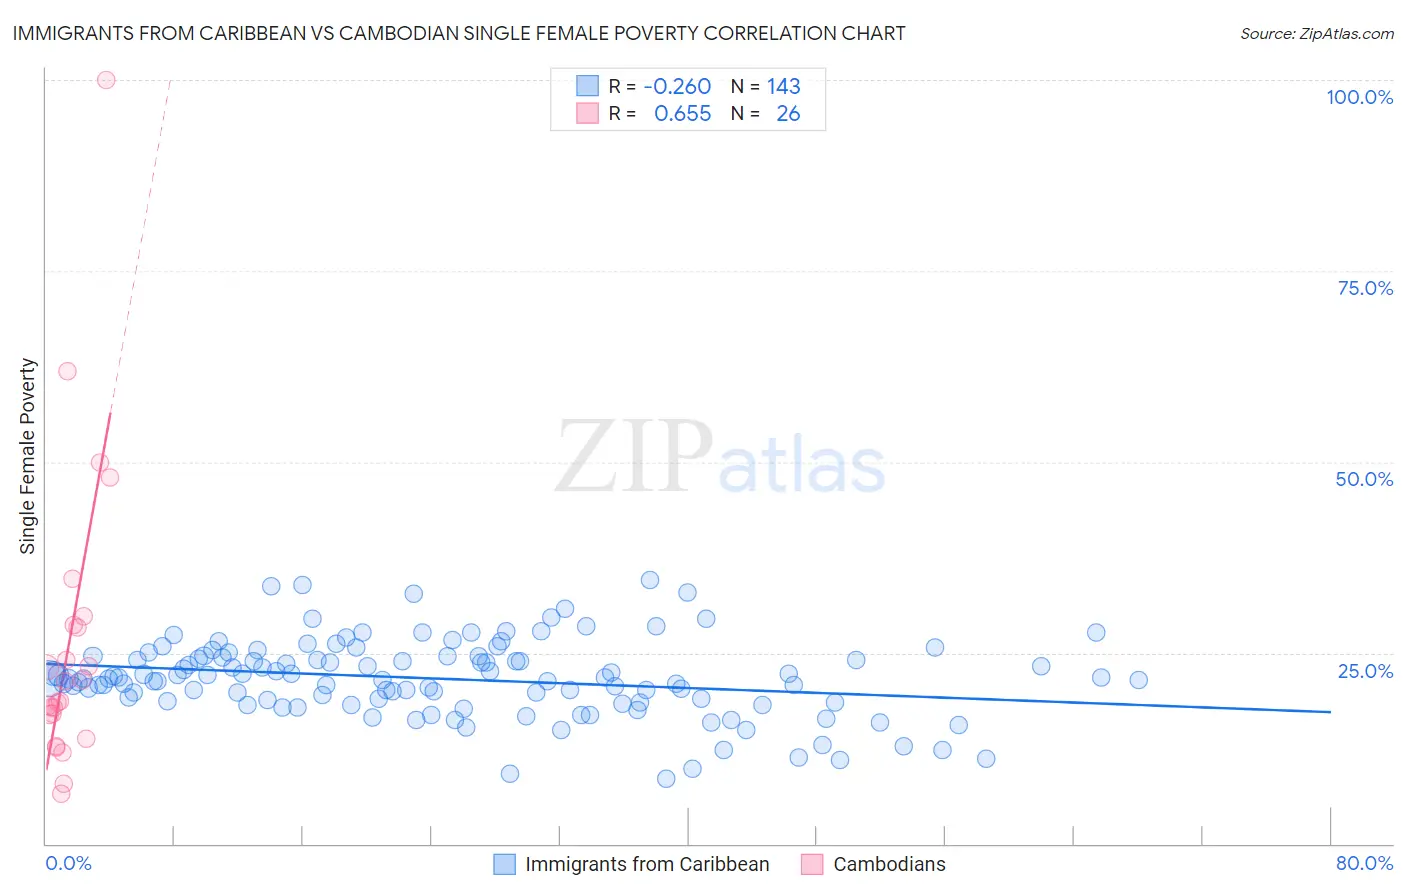
Immigrants from Caribbean vs Cambodian Single Female Poverty Correlation Chart
The statistical analysis conducted on geographies consisting of 441,756,238 people shows a weak negative correlation between the proportion of Immigrants from Caribbean and poverty level among single females in the United States with a correlation coefficient (R) of -0.260 and weighted average of 22.4%. Similarly, the statistical analysis conducted on geographies consisting of 102,115,790 people shows a significant positive correlation between the proportion of Cambodians and poverty level among single females in the United States with a correlation coefficient (R) of 0.655 and weighted average of 19.2%, a difference of 16.9%.
Single Female Poverty Correlation Summary
| Measurement | Immigrants from Caribbean | Cambodian |
| Minimum | 8.5% | 6.6% |
| Maximum | 34.5% | 100.0% |
| Range | 25.9% | 93.4% |
| Mean | 21.6% | 26.3% |
| Median | 21.7% | 19.9% |
| Interquartile 25% (IQ1) | 18.7% | 17.0% |
| Interquartile 75% (IQ3) | 24.6% | 28.6% |
| Interquartile Range (IQR) | 5.9% | 11.6% |
| Standard Deviation (Sample) | 5.0% | 19.9% |
| Standard Deviation (Population) | 5.0% | 19.5% |
Similar Demographics by Single Female Poverty
Demographics Similar to Immigrants from Caribbean by Single Female Poverty
In terms of single female poverty, the demographic groups most similar to Immigrants from Caribbean are Belizean (22.4%, a difference of 0.10%), Immigrants from El Salvador (22.4%, a difference of 0.11%), Immigrants from Bahamas (22.5%, a difference of 0.15%), Liberian (22.4%, a difference of 0.17%), and Immigrants from West Indies (22.5%, a difference of 0.29%).
| Demographics | Rating | Rank | Single Female Poverty |
| Bermudans | 2.0 /100 | #242 | Tragic 22.3% |
| West Indians | 1.9 /100 | #243 | Tragic 22.3% |
| Immigrants | Middle Africa | 1.9 /100 | #244 | Tragic 22.3% |
| Immigrants | Bangladesh | 1.8 /100 | #245 | Tragic 22.3% |
| Liberians | 1.4 /100 | #246 | Tragic 22.4% |
| Immigrants | El Salvador | 1.4 /100 | #247 | Tragic 22.4% |
| Belizeans | 1.4 /100 | #248 | Tragic 22.4% |
| Immigrants | Caribbean | 1.3 /100 | #249 | Tragic 22.4% |
| Immigrants | Bahamas | 1.2 /100 | #250 | Tragic 22.5% |
| Immigrants | West Indies | 1.0 /100 | #251 | Tragic 22.5% |
| Delaware | 1.0 /100 | #252 | Tragic 22.5% |
| Immigrants | Liberia | 0.9 /100 | #253 | Tragic 22.5% |
| Immigrants | Burma/Myanmar | 0.8 /100 | #254 | Tragic 22.6% |
| Immigrants | Sudan | 0.8 /100 | #255 | Tragic 22.6% |
| Immigrants | Belize | 0.8 /100 | #256 | Tragic 22.6% |
Demographics Similar to Cambodians by Single Female Poverty
In terms of single female poverty, the demographic groups most similar to Cambodians are Russian (19.2%, a difference of 0.020%), Lithuanian (19.2%, a difference of 0.050%), Sri Lankan (19.2%, a difference of 0.12%), Immigrants from Northern Europe (19.2%, a difference of 0.17%), and Immigrants from Europe (19.2%, a difference of 0.18%).
| Demographics | Rating | Rank | Single Female Poverty |
| Argentineans | 99.7 /100 | #54 | Exceptional 19.1% |
| Immigrants | Vietnam | 99.7 /100 | #55 | Exceptional 19.1% |
| Immigrants | Fiji | 99.7 /100 | #56 | Exceptional 19.1% |
| Eastern Europeans | 99.7 /100 | #57 | Exceptional 19.1% |
| Immigrants | Bulgaria | 99.7 /100 | #58 | Exceptional 19.1% |
| Sri Lankans | 99.6 /100 | #59 | Exceptional 19.2% |
| Russians | 99.6 /100 | #60 | Exceptional 19.2% |
| Cambodians | 99.6 /100 | #61 | Exceptional 19.2% |
| Lithuanians | 99.6 /100 | #62 | Exceptional 19.2% |
| Immigrants | Northern Europe | 99.6 /100 | #63 | Exceptional 19.2% |
| Immigrants | Europe | 99.6 /100 | #64 | Exceptional 19.2% |
| Cypriots | 99.6 /100 | #65 | Exceptional 19.2% |
| Palestinians | 99.6 /100 | #66 | Exceptional 19.2% |
| Immigrants | Egypt | 99.6 /100 | #67 | Exceptional 19.2% |
| Laotians | 99.5 /100 | #68 | Exceptional 19.3% |