Nepalese vs Cambodian Single Female Poverty
COMPARE
Nepalese
Cambodian
Single Female Poverty
Single Female Poverty Comparison
Nepalese
Cambodians
21.7%
SINGLE FEMALE POVERTY
9.7/ 100
METRIC RATING
218th/ 347
METRIC RANK
19.2%
SINGLE FEMALE POVERTY
99.6/ 100
METRIC RATING
61st/ 347
METRIC RANK
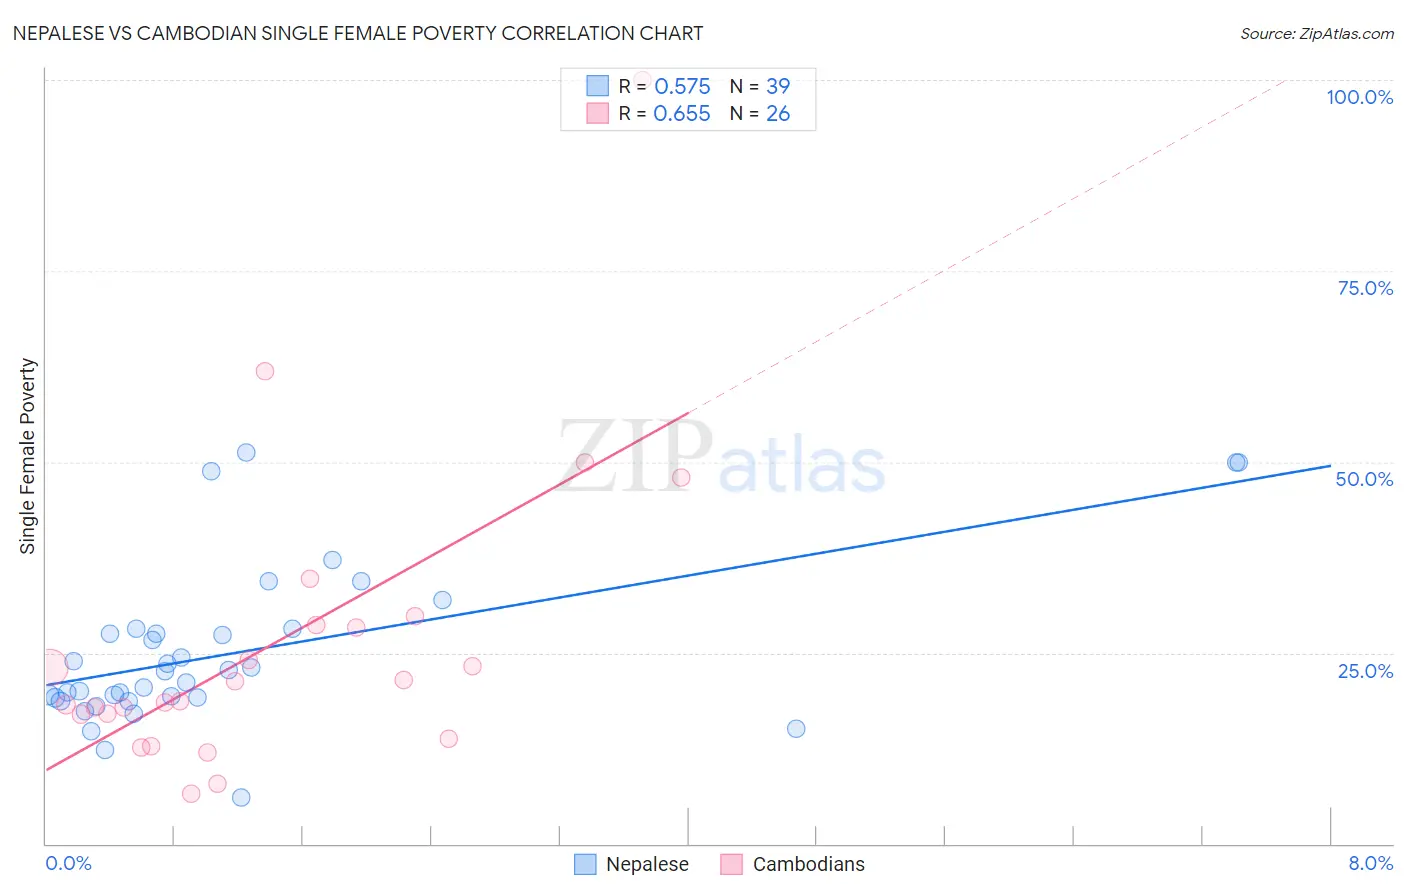
Nepalese vs Cambodian Single Female Poverty Correlation Chart
The statistical analysis conducted on geographies consisting of 24,501,098 people shows a substantial positive correlation between the proportion of Nepalese and poverty level among single females in the United States with a correlation coefficient (R) of 0.575 and weighted average of 21.7%. Similarly, the statistical analysis conducted on geographies consisting of 102,115,790 people shows a significant positive correlation between the proportion of Cambodians and poverty level among single females in the United States with a correlation coefficient (R) of 0.655 and weighted average of 19.2%, a difference of 13.3%.
Single Female Poverty Correlation Summary
| Measurement | Nepalese | Cambodian |
| Minimum | 6.1% | 6.6% |
| Maximum | 51.2% | 100.0% |
| Range | 45.1% | 93.4% |
| Mean | 25.1% | 26.3% |
| Median | 22.6% | 19.9% |
| Interquartile 25% (IQ1) | 19.1% | 17.0% |
| Interquartile 75% (IQ3) | 28.1% | 28.6% |
| Interquartile Range (IQR) | 9.0% | 11.6% |
| Standard Deviation (Sample) | 10.5% | 19.9% |
| Standard Deviation (Population) | 10.4% | 19.5% |
Similar Demographics by Single Female Poverty
Demographics Similar to Nepalese by Single Female Poverty
In terms of single female poverty, the demographic groups most similar to Nepalese are Panamanian (21.7%, a difference of 0.050%), German (21.8%, a difference of 0.26%), Immigrants from Grenada (21.8%, a difference of 0.31%), Immigrants from St. Vincent and the Grenadines (21.7%, a difference of 0.32%), and Immigrants from Eritrea (21.8%, a difference of 0.33%).
| Demographics | Rating | Rank | Single Female Poverty |
| Icelanders | 14.0 /100 | #211 | Poor 21.6% |
| Jamaicans | 14.0 /100 | #212 | Poor 21.6% |
| Guamanians/Chamorros | 13.7 /100 | #213 | Poor 21.6% |
| Immigrants | Nicaragua | 13.3 /100 | #214 | Poor 21.6% |
| Ecuadorians | 12.3 /100 | #215 | Poor 21.6% |
| Immigrants | Barbados | 12.2 /100 | #216 | Poor 21.7% |
| Immigrants | St. Vincent and the Grenadines | 11.7 /100 | #217 | Poor 21.7% |
| Nepalese | 9.7 /100 | #218 | Tragic 21.7% |
| Panamanians | 9.4 /100 | #219 | Tragic 21.7% |
| Germans | 8.3 /100 | #220 | Tragic 21.8% |
| Immigrants | Grenada | 8.0 /100 | #221 | Tragic 21.8% |
| Immigrants | Eritrea | 7.9 /100 | #222 | Tragic 21.8% |
| Scottish | 7.3 /100 | #223 | Tragic 21.8% |
| Barbadians | 7.2 /100 | #224 | Tragic 21.8% |
| English | 6.4 /100 | #225 | Tragic 21.9% |
Demographics Similar to Cambodians by Single Female Poverty
In terms of single female poverty, the demographic groups most similar to Cambodians are Russian (19.2%, a difference of 0.020%), Lithuanian (19.2%, a difference of 0.050%), Sri Lankan (19.2%, a difference of 0.12%), Immigrants from Northern Europe (19.2%, a difference of 0.17%), and Immigrants from Europe (19.2%, a difference of 0.18%).
| Demographics | Rating | Rank | Single Female Poverty |
| Argentineans | 99.7 /100 | #54 | Exceptional 19.1% |
| Immigrants | Vietnam | 99.7 /100 | #55 | Exceptional 19.1% |
| Immigrants | Fiji | 99.7 /100 | #56 | Exceptional 19.1% |
| Eastern Europeans | 99.7 /100 | #57 | Exceptional 19.1% |
| Immigrants | Bulgaria | 99.7 /100 | #58 | Exceptional 19.1% |
| Sri Lankans | 99.6 /100 | #59 | Exceptional 19.2% |
| Russians | 99.6 /100 | #60 | Exceptional 19.2% |
| Cambodians | 99.6 /100 | #61 | Exceptional 19.2% |
| Lithuanians | 99.6 /100 | #62 | Exceptional 19.2% |
| Immigrants | Northern Europe | 99.6 /100 | #63 | Exceptional 19.2% |
| Immigrants | Europe | 99.6 /100 | #64 | Exceptional 19.2% |
| Cypriots | 99.6 /100 | #65 | Exceptional 19.2% |
| Palestinians | 99.6 /100 | #66 | Exceptional 19.2% |
| Immigrants | Egypt | 99.6 /100 | #67 | Exceptional 19.2% |
| Laotians | 99.5 /100 | #68 | Exceptional 19.3% |