Yup'ik vs Immigrants from South Africa Female Poverty

COMPARE

Yup'ik
Race
Ancestry
AfghanAfricanAlaska NativeAlaskan AthabascanAlbanianAleutAlsatianAmericanApacheArabArapahoArgentineanArmenianAssyrian/Chaldean/SyriacAustralianAustrianBahamianBangladeshiBarbadianBasqueBelgianBelizeanBermudanBhutaneseBlackfeetBolivianBrazilianBritishBritish West IndianBulgarianBurmeseCajunCambodianCanadianCape VerdeanCarpatho RusynCelticCentral AmericanCentral American IndianCherokeeCheyenneChickasawChileanChineseChippewaChoctawColombianColvilleComancheCosta RicanCreeCreekCroatianCrowCubanCypriotCzechCzechoslovakianDanishDelawareDominicanDutchDutch West IndianEastern EuropeanEcuadorianEgyptianEnglishEstonianEthiopianEuropeanFijianFilipinoFinnishFrenchFrench American IndianFrench CanadianGermanGerman RussianGhanaianGreekGuamanian/ChamorroGuatemalanGuyaneseHaitianHmongHonduranHopiHoumaHungarianIcelanderIndian (Asian)IndonesianInupiatIranianIraqiIrishIroquoisIsraeliItalianJamaicanJapaneseJordanianKenyanKiowaKoreanLaotianLatvianLebaneseLiberianLithuanianLumbeeLuxembourgerMacedonianMalaysianMalteseMarshalleseMenomineeMexicanMexican American IndianMongolianMoroccanNative HawaiianNavajoNepaleseNew ZealanderNicaraguanNigerianNorthern EuropeanNorwegianOkinawanOsageOttawaPaiutePakistaniPalestinianPanamanianParaguayanPennsylvania GermanPeruvianPimaPolishPortuguesePotawatomiPuebloPuerto RicanPuget Sound SalishRomanianRussianSalvadoranSamoanScandinavianScotch-IrishScottishSeminoleSenegaleseSerbianShoshoneSierra LeoneanSiouxSlavicSlovakSloveneSomaliSouth AfricanSouth AmericanSouth American IndianSoviet UnionSpaniardSpanishSpanish AmericanSpanish American IndianSri LankanSubsaharan AfricanSudaneseSwedishSwissSyrianTaiwaneseThaiTlingit-HaidaTohono O'OdhamTonganTrinidadian and TobagonianTsimshianTurkishU.S. Virgin IslanderUgandanUkrainianUruguayanUteVenezuelanVietnameseWelshWest IndianYakamaYaquiYugoslavianYumanYup'ikZimbabwean
Immigration
NonimmigrantsImmigrantsAfghanistanAfricaAlbaniaArgentinaArmeniaAsiaAustraliaAustriaBahamasBangladeshBarbadosBelarusBelgiumBelizeBoliviaBosnia and HerzegovinaBrazilBulgariaBurma/MyanmarCabo VerdeCambodiaCameroonCanadaCaribbeanCentral AmericaChileChinaColombiaCongoCosta RicaCroatiaCubaCzechoslovakiaDenmarkDominicaDominican RepublicEastern AfricaEastern AsiaEastern EuropeEcuadorEgyptEl SalvadorEnglandEritreaEthiopiaEuropeFijiFranceGermanyGhanaGreeceGrenadaGuatemalaGuyanaHaitiHondurasHong KongHungaryIndiaIndonesiaIranIraqIrelandIsraelItalyJamaicaJapanJordanKazakhstanKenyaKoreaKuwaitLaosLatin AmericaLatviaLebanonLiberiaLithuaniaMalaysiaMexicoMicronesiaMiddle AfricaMoldovaMoroccoNepalNetherlandsNicaraguaNigeriaNorth AmericaNorth MacedoniaNorthern AfricaNorthern EuropeNorwayOceaniaPakistanPanamaPeruPhilippinesPolandPortugalRomaniaRussiaSaudi ArabiaScotlandSenegalSerbiaSierra LeoneSingaporeSomaliaSouth AmericaSouth Central AsiaSouth Eastern AsiaSouthern EuropeSpainSri LankaSt. Vincent and the GrenadinesSudanSwedenSwitzerlandSyriaTaiwanThailandTrinidad and TobagoTurkeyUgandaUkraineUruguayUzbekistanVenezuelaVietnamWest IndiesWestern AfricaWestern AsiaWestern EuropeYemenZaireZimbabweAzores
Immigrants from South Africa
Race
Ancestry
AfghanAfricanAlaska NativeAlaskan AthabascanAlbanianAleutAlsatianAmericanApacheArabArapahoArgentineanArmenianAssyrian/Chaldean/SyriacAustralianAustrianBahamianBangladeshiBarbadianBasqueBelgianBelizeanBermudanBhutaneseBlackfeetBolivianBrazilianBritishBritish West IndianBulgarianBurmeseCajunCambodianCanadianCape VerdeanCarpatho RusynCelticCentral AmericanCentral American IndianCherokeeCheyenneChickasawChileanChineseChippewaChoctawColombianColvilleComancheCosta RicanCreeCreekCroatianCrowCubanCypriotCzechCzechoslovakianDanishDelawareDominicanDutchDutch West IndianEastern EuropeanEcuadorianEgyptianEnglishEstonianEthiopianEuropeanFijianFilipinoFinnishFrenchFrench American IndianFrench CanadianGermanGerman RussianGhanaianGreekGuamanian/ChamorroGuatemalanGuyaneseHaitianHmongHonduranHopiHoumaHungarianIcelanderIndian (Asian)IndonesianInupiatIranianIraqiIrishIroquoisIsraeliItalianJamaicanJapaneseJordanianKenyanKiowaKoreanLaotianLatvianLebaneseLiberianLithuanianLumbeeLuxembourgerMacedonianMalaysianMalteseMarshalleseMenomineeMexicanMexican American IndianMongolianMoroccanNative HawaiianNavajoNepaleseNew ZealanderNicaraguanNigerianNorthern EuropeanNorwegianOkinawanOsageOttawaPaiutePakistaniPalestinianPanamanianParaguayanPennsylvania GermanPeruvianPimaPolishPortuguesePotawatomiPuebloPuerto RicanPuget Sound SalishRomanianRussianSalvadoranSamoanScandinavianScotch-IrishScottishSeminoleSenegaleseSerbianShoshoneSierra LeoneanSiouxSlavicSlovakSloveneSomaliSouth AfricanSouth AmericanSouth American IndianSoviet UnionSpaniardSpanishSpanish AmericanSpanish American IndianSri LankanSubsaharan AfricanSudaneseSwedishSwissSyrianTaiwaneseThaiTlingit-HaidaTohono O'OdhamTonganTrinidadian and TobagonianTsimshianTurkishU.S. Virgin IslanderUgandanUkrainianUruguayanUteVenezuelanVietnameseWelshWest IndianYakamaYaquiYugoslavianYumanZimbabwean
Immigration
NonimmigrantsImmigrantsAfghanistanAfricaAlbaniaArgentinaArmeniaAsiaAustraliaAustriaBahamasBangladeshBarbadosBelarusBelgiumBelizeBoliviaBosnia and HerzegovinaBrazilBulgariaBurma/MyanmarCabo VerdeCambodiaCameroonCanadaCaribbeanCentral AmericaChileChinaColombiaCongoCosta RicaCroatiaCubaCzechoslovakiaDenmarkDominicaDominican RepublicEastern AfricaEastern AsiaEastern EuropeEcuadorEgyptEl SalvadorEnglandEritreaEthiopiaEuropeFijiFranceGermanyGhanaGreeceGrenadaGuatemalaGuyanaHaitiHondurasHong KongHungaryIndiaIndonesiaIranIraqIrelandIsraelItalyJamaicaJapanJordanKazakhstanKenyaKoreaKuwaitLaosLatin AmericaLatviaLebanonLiberiaLithuaniaMalaysiaMexicoMicronesiaMiddle AfricaMoldovaMoroccoNepalNetherlandsNicaraguaNigeriaNorth AmericaNorth MacedoniaNorthern AfricaNorthern EuropeNorwayOceaniaPakistanPanamaPeruPhilippinesPolandPortugalRomaniaRussiaSaudi ArabiaScotlandSenegalSerbiaSierra LeoneSingaporeSomaliaSouth AfricaSouth AmericaSouth Central AsiaSouth Eastern AsiaSouthern EuropeSpainSri LankaSt. Vincent and the GrenadinesSudanSwedenSwitzerlandSyriaTaiwanThailandTrinidad and TobagoTurkeyUgandaUkraineUruguayUzbekistanVenezuelaVietnamWest IndiesWestern AfricaWestern AsiaWestern EuropeYemenZaireZimbabweAzores
Female Poverty
Income
Poverty
Unemployment
Labor Participation
Family Structure
Vehicle Availability
Education Level
Disability

Female Poverty Comparison

Yup'ik

Immigrants from South Africa

Tragic
Exceptional
21.5%
FEMALE POVERTY
0.0/ 100
METRIC RATING
340th/ 347
METRIC RANK
12.5%
FEMALE POVERTY
95.4/ 100
METRIC RATING
95th/ 347
METRIC RANK

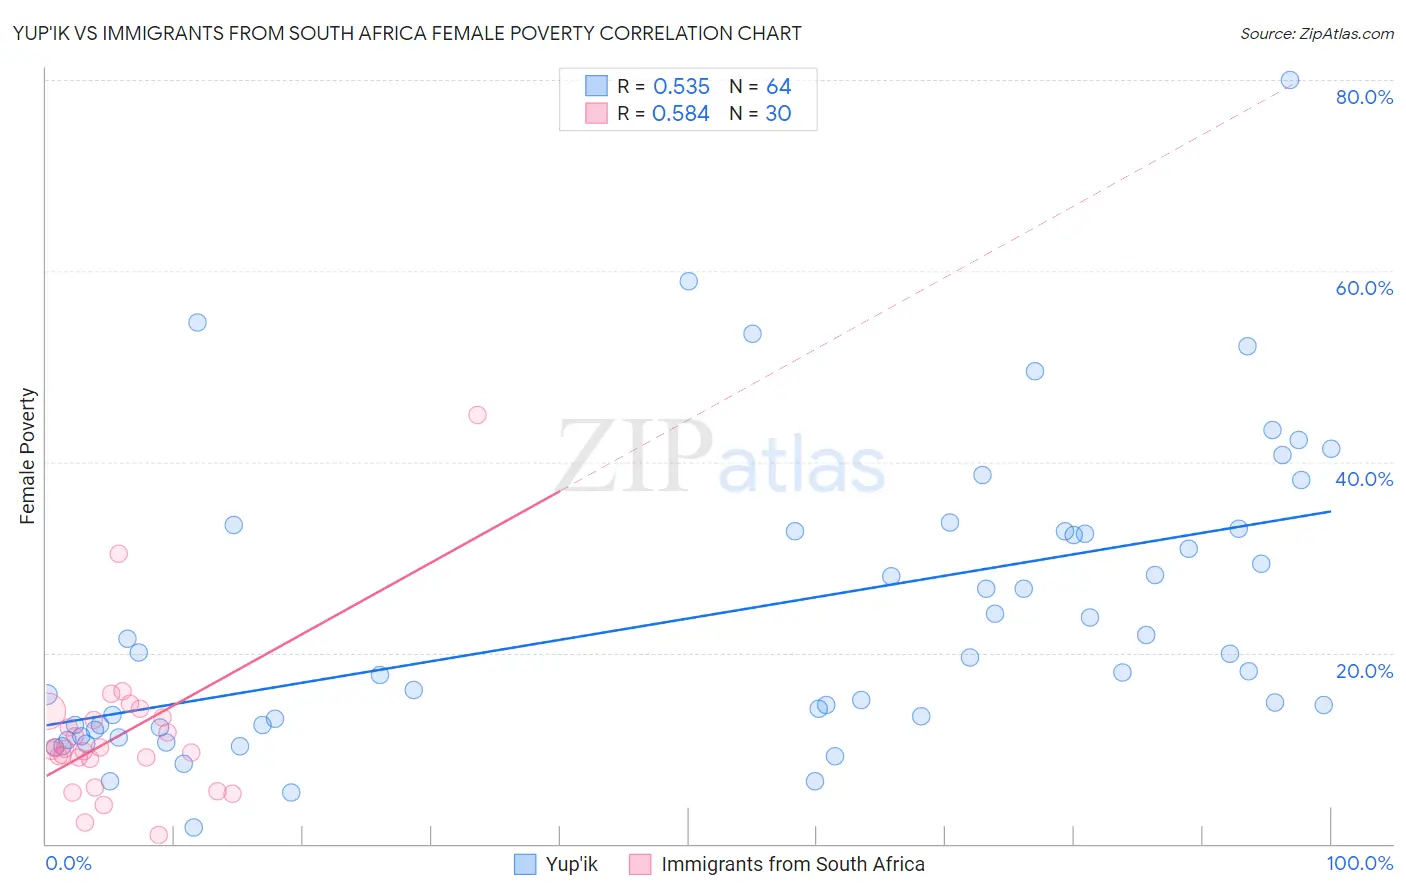
Yup'ik vs Immigrants from South Africa Female Poverty Correlation Chart

The statistical analysis conducted on geographies consisting of 39,953,157 people shows a substantial positive correlation between the proportion of Yup'ik and poverty level among females in the United States with a correlation coefficient (R) of 0.535 and weighted average of 21.5%. Similarly, the statistical analysis conducted on geographies consisting of 233,245,302 people shows a substantial positive correlation between the proportion of Immigrants from South Africa and poverty level among females in the United States with a correlation coefficient (R) of 0.584 and weighted average of 12.5%, a difference of 72.4%.
Yup'ik vs Immigrants from South Africa Female Poverty

Female Poverty Correlation Summary

MeasurementYup'ikImmigrants from South Africa
Minimum1.7%0.91%
Maximum80.0%44.9%
Range78.3%44.0%
Mean23.8%11.5%
Median18.8%9.9%
Interquartile 25% (IQ1)12.3%8.9%
Interquartile 75% (IQ3)32.8%13.2%
Interquartile Range (IQR)20.4%4.3%
Standard Deviation (Sample)15.5%8.3%
Standard Deviation (Population)15.4%8.1%

Similar Demographics by Female Poverty

Demographics Similar to Yup'ik by Female Poverty

In terms of female poverty, the demographic groups most similar to Yup'ik are Hopi (21.0%, a difference of 2.5%), Sioux (20.9%, a difference of 2.9%), Crow (22.1%, a difference of 3.0%), Yuman (20.8%, a difference of 3.1%), and Pueblo (20.7%, a difference of 3.9%).
DemographicsRating | RankFemale Poverty
Immigrants | Dominican Republic
0.0
/100
|
#333
Tragic
19.3%
Houma
0.0
/100
|
#334
Tragic
20.0%
Cheyenne
0.0
/100
|
#335
Tragic
20.2%
Pueblo
0.0
/100
|
#336
Tragic
20.7%
Yuman
0.0
/100
|
#337
Tragic
20.8%
Sioux
0.0
/100
|
#338
Tragic
20.9%
Hopi
0.0
/100
|
#339
Tragic
21.0%
Yup'ik
0.0
/100
|
#340
Tragic
21.5%
Crow
0.0
/100
|
#341
Tragic
22.1%
Immigrants | Yemen
0.0
/100
|
#342
Tragic
22.8%
Lumbee
0.0
/100
|
#343
Tragic
23.5%
Pima
0.0
/100
|
#344
Tragic
23.6%
Navajo
0.0
/100
|
#345
Tragic
23.9%
Puerto Ricans
0.0
/100
|
#346
Tragic
25.2%
Tohono O'odham
0.0
/100
|
#347
Tragic
25.9%

Demographics Similar to Immigrants from South Africa by Female Poverty

In terms of female poverty, the demographic groups most similar to Immigrants from South Africa are Immigrants from Indonesia (12.5%, a difference of 0.040%), Immigrants from Egypt (12.5%, a difference of 0.070%), British (12.5%, a difference of 0.070%), Australian (12.5%, a difference of 0.10%), and Native Hawaiian (12.5%, a difference of 0.13%).
DemographicsRating | RankFemale Poverty
Finns
96.4
/100
|
#88
Exceptional
12.4%
English
96.1
/100
|
#89
Exceptional
12.4%
Immigrants | Denmark
95.8
/100
|
#90
Exceptional
12.4%
Belgians
95.8
/100
|
#91
Exceptional
12.4%
Czechoslovakians
95.7
/100
|
#92
Exceptional
12.4%
Immigrants | Egypt
95.5
/100
|
#93
Exceptional
12.5%
Immigrants | Indonesia
95.4
/100
|
#94
Exceptional
12.5%
Immigrants | South Africa
95.4
/100
|
#95
Exceptional
12.5%
British
95.2
/100
|
#96
Exceptional
12.5%
Australians
95.2
/100
|
#97
Exceptional
12.5%
Native Hawaiians
95.1
/100
|
#98
Exceptional
12.5%
Romanians
95.1
/100
|
#99
Exceptional
12.5%
Immigrants | Latvia
94.8
/100
|
#100
Exceptional
12.5%
Tlingit-Haida
94.8
/100
|
#101
Exceptional
12.5%
Immigrants | China
94.5
/100
|
#102
Exceptional
12.5%