Latvian vs Immigrants from South Africa Female Poverty
COMPARE
Latvian
Immigrants from South Africa
Female Poverty
Female Poverty Comparison
Latvians
Immigrants from South Africa
11.4%
FEMALE POVERTY
99.8/ 100
METRIC RATING
15th/ 347
METRIC RANK
12.5%
FEMALE POVERTY
95.4/ 100
METRIC RATING
95th/ 347
METRIC RANK
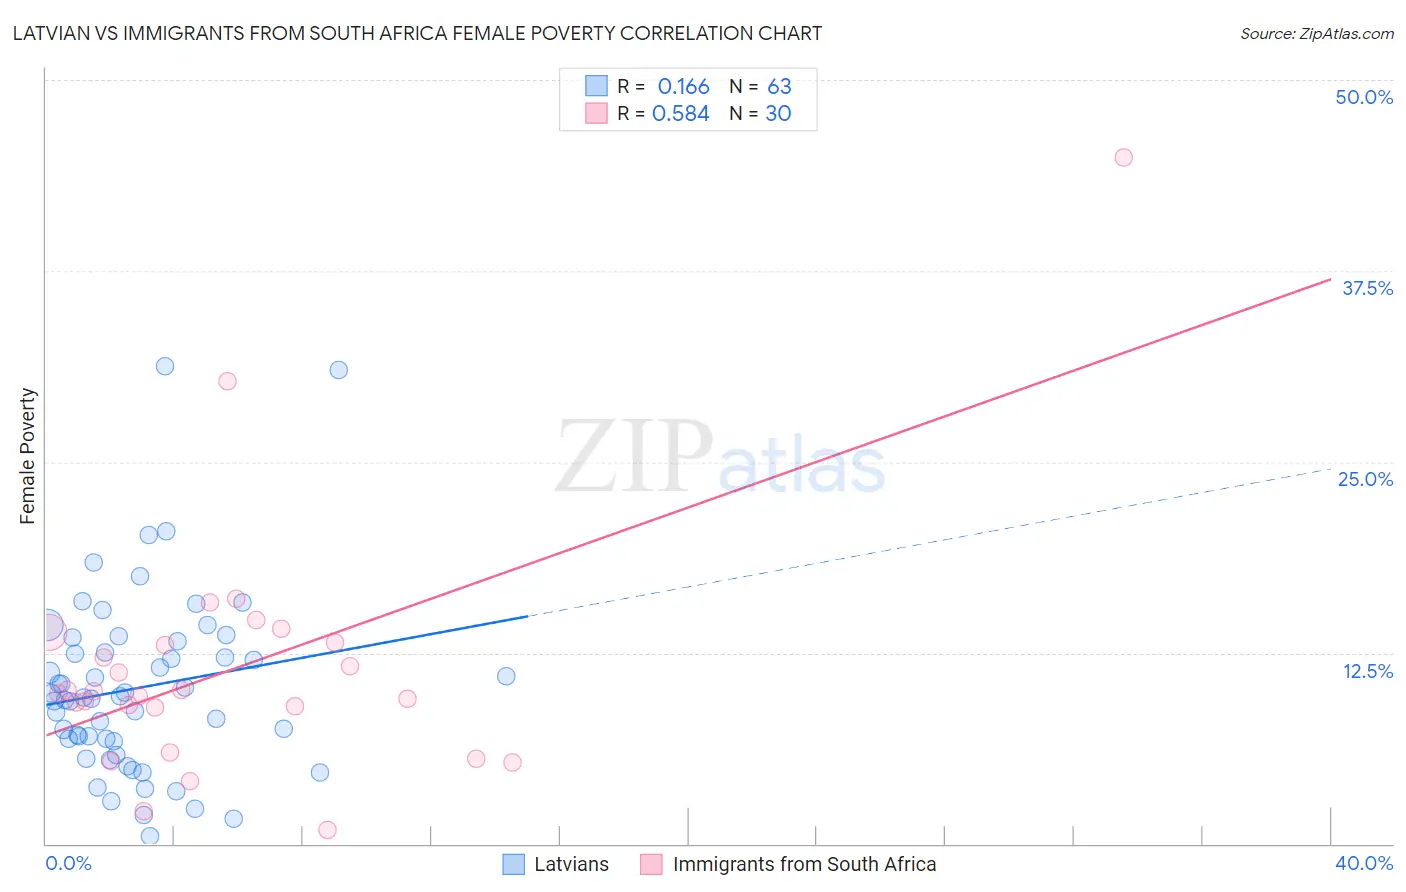
Latvian vs Immigrants from South Africa Female Poverty Correlation Chart
The statistical analysis conducted on geographies consisting of 220,618,449 people shows a poor positive correlation between the proportion of Latvians and poverty level among females in the United States with a correlation coefficient (R) of 0.166 and weighted average of 11.4%. Similarly, the statistical analysis conducted on geographies consisting of 233,245,302 people shows a substantial positive correlation between the proportion of Immigrants from South Africa and poverty level among females in the United States with a correlation coefficient (R) of 0.584 and weighted average of 12.5%, a difference of 9.0%.
Female Poverty Correlation Summary
| Measurement | Latvian | Immigrants from South Africa |
| Minimum | 0.50% | 0.91% |
| Maximum | 31.3% | 44.9% |
| Range | 30.8% | 44.0% |
| Mean | 10.2% | 11.5% |
| Median | 9.6% | 9.9% |
| Interquartile 25% (IQ1) | 6.7% | 8.9% |
| Interquartile 75% (IQ3) | 13.3% | 13.2% |
| Interquartile Range (IQR) | 6.5% | 4.3% |
| Standard Deviation (Sample) | 5.9% | 8.3% |
| Standard Deviation (Population) | 5.9% | 8.1% |
Similar Demographics by Female Poverty
Demographics Similar to Latvians by Female Poverty
In terms of female poverty, the demographic groups most similar to Latvians are Lithuanian (11.4%, a difference of 0.32%), Immigrants from Bolivia (11.5%, a difference of 0.47%), Bolivian (11.5%, a difference of 0.54%), Immigrants from Scotland (11.5%, a difference of 0.59%), and Norwegian (11.5%, a difference of 0.64%).
| Demographics | Rating | Rank | Female Poverty |
| Immigrants | South Central Asia | 99.9 /100 | #8 | Exceptional 11.1% |
| Bulgarians | 99.9 /100 | #9 | Exceptional 11.1% |
| Immigrants | Hong Kong | 99.9 /100 | #10 | Exceptional 11.2% |
| Maltese | 99.9 /100 | #11 | Exceptional 11.2% |
| Bhutanese | 99.9 /100 | #12 | Exceptional 11.3% |
| Immigrants | Lithuania | 99.9 /100 | #13 | Exceptional 11.3% |
| Lithuanians | 99.8 /100 | #14 | Exceptional 11.4% |
| Latvians | 99.8 /100 | #15 | Exceptional 11.4% |
| Immigrants | Bolivia | 99.8 /100 | #16 | Exceptional 11.5% |
| Bolivians | 99.8 /100 | #17 | Exceptional 11.5% |
| Immigrants | Scotland | 99.8 /100 | #18 | Exceptional 11.5% |
| Norwegians | 99.8 /100 | #19 | Exceptional 11.5% |
| Eastern Europeans | 99.7 /100 | #20 | Exceptional 11.5% |
| Italians | 99.7 /100 | #21 | Exceptional 11.6% |
| Swedes | 99.7 /100 | #22 | Exceptional 11.6% |
Demographics Similar to Immigrants from South Africa by Female Poverty
In terms of female poverty, the demographic groups most similar to Immigrants from South Africa are Immigrants from Indonesia (12.5%, a difference of 0.040%), Immigrants from Egypt (12.5%, a difference of 0.070%), British (12.5%, a difference of 0.070%), Australian (12.5%, a difference of 0.10%), and Native Hawaiian (12.5%, a difference of 0.13%).
| Demographics | Rating | Rank | Female Poverty |
| Finns | 96.4 /100 | #88 | Exceptional 12.4% |
| English | 96.1 /100 | #89 | Exceptional 12.4% |
| Immigrants | Denmark | 95.8 /100 | #90 | Exceptional 12.4% |
| Belgians | 95.8 /100 | #91 | Exceptional 12.4% |
| Czechoslovakians | 95.7 /100 | #92 | Exceptional 12.4% |
| Immigrants | Egypt | 95.5 /100 | #93 | Exceptional 12.5% |
| Immigrants | Indonesia | 95.4 /100 | #94 | Exceptional 12.5% |
| Immigrants | South Africa | 95.4 /100 | #95 | Exceptional 12.5% |
| British | 95.2 /100 | #96 | Exceptional 12.5% |
| Australians | 95.2 /100 | #97 | Exceptional 12.5% |
| Native Hawaiians | 95.1 /100 | #98 | Exceptional 12.5% |
| Romanians | 95.1 /100 | #99 | Exceptional 12.5% |
| Immigrants | Latvia | 94.8 /100 | #100 | Exceptional 12.5% |
| Tlingit-Haida | 94.8 /100 | #101 | Exceptional 12.5% |
| Immigrants | China | 94.5 /100 | #102 | Exceptional 12.5% |