Yup'ik vs Immigrants from South Africa 5th Grade

COMPARE

Yup'ik
Race
Ancestry
AfghanAfricanAlaska NativeAlaskan AthabascanAlbanianAleutAlsatianAmericanApacheArabArapahoArgentineanArmenianAssyrian/Chaldean/SyriacAustralianAustrianBahamianBangladeshiBarbadianBasqueBelgianBelizeanBermudanBhutaneseBlackfeetBolivianBrazilianBritishBritish West IndianBulgarianBurmeseCajunCambodianCanadianCape VerdeanCarpatho RusynCelticCentral AmericanCentral American IndianCherokeeCheyenneChickasawChileanChineseChippewaChoctawColombianColvilleComancheCosta RicanCreeCreekCroatianCrowCubanCypriotCzechCzechoslovakianDanishDelawareDominicanDutchDutch West IndianEastern EuropeanEcuadorianEgyptianEnglishEstonianEthiopianEuropeanFijianFilipinoFinnishFrenchFrench American IndianFrench CanadianGermanGerman RussianGhanaianGreekGuamanian/ChamorroGuatemalanGuyaneseHaitianHmongHonduranHopiHoumaHungarianIcelanderIndian (Asian)IndonesianInupiatIranianIraqiIrishIroquoisIsraeliItalianJamaicanJapaneseJordanianKenyanKiowaKoreanLaotianLatvianLebaneseLiberianLithuanianLumbeeLuxembourgerMacedonianMalaysianMalteseMarshalleseMenomineeMexicanMexican American IndianMongolianMoroccanNative HawaiianNavajoNepaleseNew ZealanderNicaraguanNigerianNorthern EuropeanNorwegianOkinawanOsageOttawaPaiutePakistaniPalestinianPanamanianParaguayanPennsylvania GermanPeruvianPimaPolishPortuguesePotawatomiPuebloPuerto RicanPuget Sound SalishRomanianRussianSalvadoranSamoanScandinavianScotch-IrishScottishSeminoleSenegaleseSerbianShoshoneSierra LeoneanSiouxSlavicSlovakSloveneSomaliSouth AfricanSouth AmericanSouth American IndianSoviet UnionSpaniardSpanishSpanish AmericanSpanish American IndianSri LankanSubsaharan AfricanSudaneseSwedishSwissSyrianTaiwaneseThaiTlingit-HaidaTohono O'OdhamTonganTrinidadian and TobagonianTsimshianTurkishU.S. Virgin IslanderUgandanUkrainianUruguayanUteVenezuelanVietnameseWelshWest IndianYakamaYaquiYugoslavianYumanYup'ikZimbabwean
Immigration
NonimmigrantsImmigrantsAfghanistanAfricaAlbaniaArgentinaArmeniaAsiaAustraliaAustriaBahamasBangladeshBarbadosBelarusBelgiumBelizeBoliviaBosnia and HerzegovinaBrazilBulgariaBurma/MyanmarCabo VerdeCambodiaCameroonCanadaCaribbeanCentral AmericaChileChinaColombiaCongoCosta RicaCroatiaCubaCzechoslovakiaDenmarkDominicaDominican RepublicEastern AfricaEastern AsiaEastern EuropeEcuadorEgyptEl SalvadorEnglandEritreaEthiopiaEuropeFijiFranceGermanyGhanaGreeceGrenadaGuatemalaGuyanaHaitiHondurasHong KongHungaryIndiaIndonesiaIranIraqIrelandIsraelItalyJamaicaJapanJordanKazakhstanKenyaKoreaKuwaitLaosLatin AmericaLatviaLebanonLiberiaLithuaniaMalaysiaMexicoMicronesiaMiddle AfricaMoldovaMoroccoNepalNetherlandsNicaraguaNigeriaNorth AmericaNorth MacedoniaNorthern AfricaNorthern EuropeNorwayOceaniaPakistanPanamaPeruPhilippinesPolandPortugalRomaniaRussiaSaudi ArabiaScotlandSenegalSerbiaSierra LeoneSingaporeSomaliaSouth AmericaSouth Central AsiaSouth Eastern AsiaSouthern EuropeSpainSri LankaSt. Vincent and the GrenadinesSudanSwedenSwitzerlandSyriaTaiwanThailandTrinidad and TobagoTurkeyUgandaUkraineUruguayUzbekistanVenezuelaVietnamWest IndiesWestern AfricaWestern AsiaWestern EuropeYemenZaireZimbabweAzores
Immigrants from South Africa
Race
Ancestry
AfghanAfricanAlaska NativeAlaskan AthabascanAlbanianAleutAlsatianAmericanApacheArabArapahoArgentineanArmenianAssyrian/Chaldean/SyriacAustralianAustrianBahamianBangladeshiBarbadianBasqueBelgianBelizeanBermudanBhutaneseBlackfeetBolivianBrazilianBritishBritish West IndianBulgarianBurmeseCajunCambodianCanadianCape VerdeanCarpatho RusynCelticCentral AmericanCentral American IndianCherokeeCheyenneChickasawChileanChineseChippewaChoctawColombianColvilleComancheCosta RicanCreeCreekCroatianCrowCubanCypriotCzechCzechoslovakianDanishDelawareDominicanDutchDutch West IndianEastern EuropeanEcuadorianEgyptianEnglishEstonianEthiopianEuropeanFijianFilipinoFinnishFrenchFrench American IndianFrench CanadianGermanGerman RussianGhanaianGreekGuamanian/ChamorroGuatemalanGuyaneseHaitianHmongHonduranHopiHoumaHungarianIcelanderIndian (Asian)IndonesianInupiatIranianIraqiIrishIroquoisIsraeliItalianJamaicanJapaneseJordanianKenyanKiowaKoreanLaotianLatvianLebaneseLiberianLithuanianLumbeeLuxembourgerMacedonianMalaysianMalteseMarshalleseMenomineeMexicanMexican American IndianMongolianMoroccanNative HawaiianNavajoNepaleseNew ZealanderNicaraguanNigerianNorthern EuropeanNorwegianOkinawanOsageOttawaPaiutePakistaniPalestinianPanamanianParaguayanPennsylvania GermanPeruvianPimaPolishPortuguesePotawatomiPuebloPuerto RicanPuget Sound SalishRomanianRussianSalvadoranSamoanScandinavianScotch-IrishScottishSeminoleSenegaleseSerbianShoshoneSierra LeoneanSiouxSlavicSlovakSloveneSomaliSouth AfricanSouth AmericanSouth American IndianSoviet UnionSpaniardSpanishSpanish AmericanSpanish American IndianSri LankanSubsaharan AfricanSudaneseSwedishSwissSyrianTaiwaneseThaiTlingit-HaidaTohono O'OdhamTonganTrinidadian and TobagonianTsimshianTurkishU.S. Virgin IslanderUgandanUkrainianUruguayanUteVenezuelanVietnameseWelshWest IndianYakamaYaquiYugoslavianYumanZimbabwean
Immigration
NonimmigrantsImmigrantsAfghanistanAfricaAlbaniaArgentinaArmeniaAsiaAustraliaAustriaBahamasBangladeshBarbadosBelarusBelgiumBelizeBoliviaBosnia and HerzegovinaBrazilBulgariaBurma/MyanmarCabo VerdeCambodiaCameroonCanadaCaribbeanCentral AmericaChileChinaColombiaCongoCosta RicaCroatiaCubaCzechoslovakiaDenmarkDominicaDominican RepublicEastern AfricaEastern AsiaEastern EuropeEcuadorEgyptEl SalvadorEnglandEritreaEthiopiaEuropeFijiFranceGermanyGhanaGreeceGrenadaGuatemalaGuyanaHaitiHondurasHong KongHungaryIndiaIndonesiaIranIraqIrelandIsraelItalyJamaicaJapanJordanKazakhstanKenyaKoreaKuwaitLaosLatin AmericaLatviaLebanonLiberiaLithuaniaMalaysiaMexicoMicronesiaMiddle AfricaMoldovaMoroccoNepalNetherlandsNicaraguaNigeriaNorth AmericaNorth MacedoniaNorthern AfricaNorthern EuropeNorwayOceaniaPakistanPanamaPeruPhilippinesPolandPortugalRomaniaRussiaSaudi ArabiaScotlandSenegalSerbiaSierra LeoneSingaporeSomaliaSouth AfricaSouth AmericaSouth Central AsiaSouth Eastern AsiaSouthern EuropeSpainSri LankaSt. Vincent and the GrenadinesSudanSwedenSwitzerlandSyriaTaiwanThailandTrinidad and TobagoTurkeyUgandaUkraineUruguayUzbekistanVenezuelaVietnamWest IndiesWestern AfricaWestern AsiaWestern EuropeYemenZaireZimbabweAzores
5th Grade
Income
Poverty
Unemployment
Labor Participation
Family Structure
Vehicle Availability
Education Level
Disability

5th Grade Comparison

Yup'ik

Immigrants from South Africa

Exceptional
Exceptional
98.2%
5TH GRADE
100.0/ 100
METRIC RATING
25th/ 347
METRIC RANK
97.8%
5TH GRADE
98.8/ 100
METRIC RATING
89th/ 347
METRIC RANK

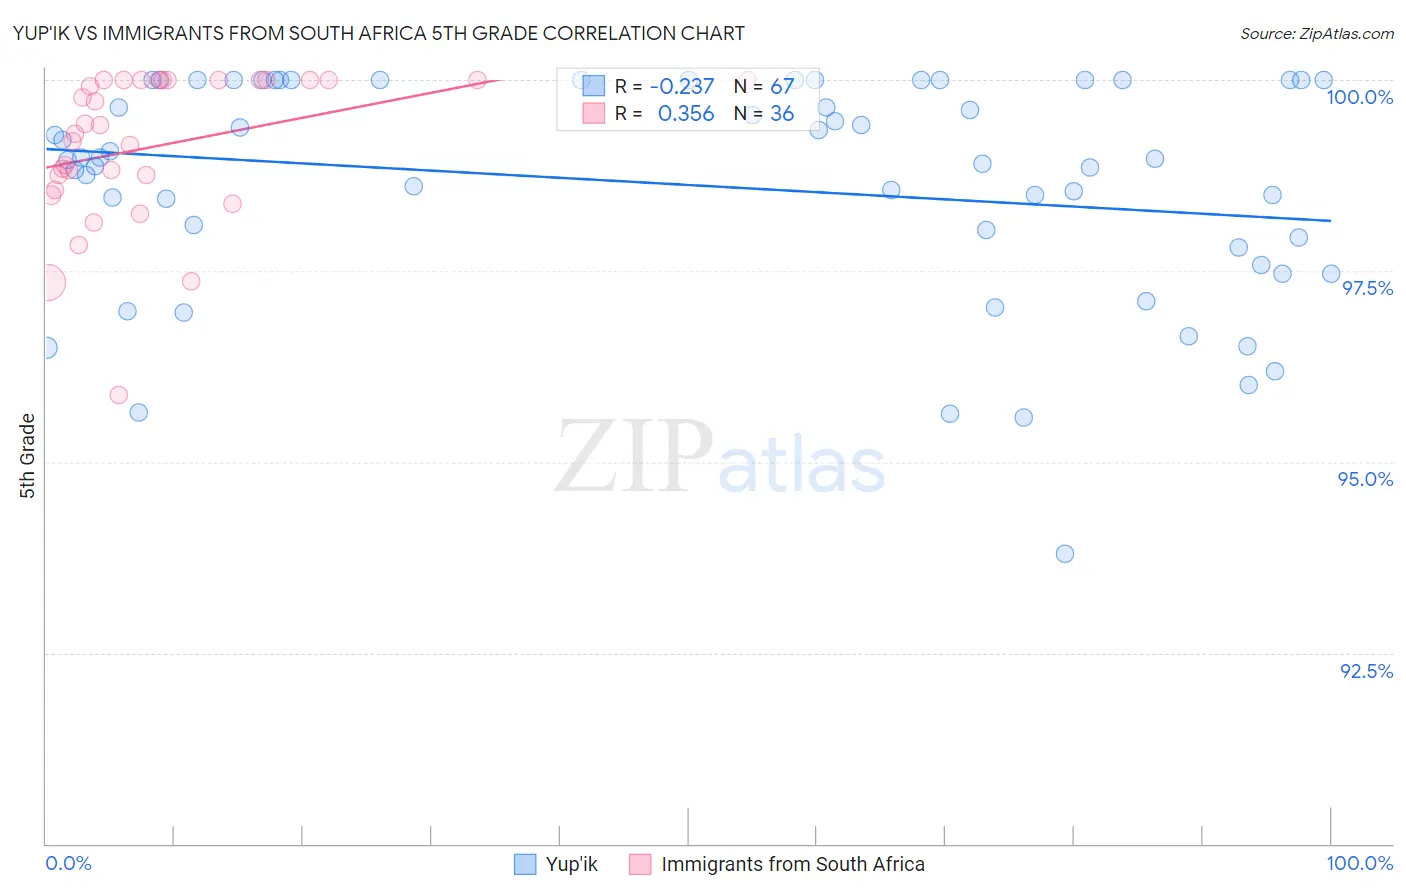
Yup'ik vs Immigrants from South Africa 5th Grade Correlation Chart

The statistical analysis conducted on geographies consisting of 39,964,464 people shows a weak negative correlation between the proportion of Yup'ik and percentage of population with at least 5th grade education in the United States with a correlation coefficient (R) of -0.237 and weighted average of 98.2%. Similarly, the statistical analysis conducted on geographies consisting of 233,321,693 people shows a mild positive correlation between the proportion of Immigrants from South Africa and percentage of population with at least 5th grade education in the United States with a correlation coefficient (R) of 0.356 and weighted average of 97.8%, a difference of 0.43%.
Yup'ik vs Immigrants from South Africa 5th Grade

5th Grade Correlation Summary

MeasurementYup'ikImmigrants from South Africa
Minimum93.8%95.9%
Maximum100.0%100.0%
Range6.2%4.1%
Mean98.6%99.1%
Median99.0%99.4%
Interquartile 25% (IQ1)97.8%98.7%
Interquartile 75% (IQ3)100.0%100.0%
Interquartile Range (IQR)2.2%1.3%
Standard Deviation (Sample)1.4%0.98%
Standard Deviation (Population)1.4%0.97%

Similar Demographics by 5th Grade

Demographics Similar to Yup'ik by 5th Grade

In terms of 5th grade, the demographic groups most similar to Yup'ik are Alaska Native (98.2%, a difference of 0.0%), Croatian (98.2%, a difference of 0.010%), Sioux (98.2%, a difference of 0.010%), Scotch-Irish (98.2%, a difference of 0.010%), and French (98.2%, a difference of 0.010%).
DemographicsRating | Rank5th Grade
Pennsylvania Germans
100.0
/100
|
#18
Exceptional
98.3%
Finns
100.0
/100
|
#19
Exceptional
98.2%
Lithuanians
100.0
/100
|
#20
Exceptional
98.2%
Danes
100.0
/100
|
#21
Exceptional
98.2%
Croatians
100.0
/100
|
#22
Exceptional
98.2%
Sioux
100.0
/100
|
#23
Exceptional
98.2%
Scotch-Irish
100.0
/100
|
#24
Exceptional
98.2%
Yup'ik
100.0
/100
|
#25
Exceptional
98.2%
Alaska Natives
100.0
/100
|
#26
Exceptional
98.2%
French
100.0
/100
|
#27
Exceptional
98.2%
Czechs
100.0
/100
|
#28
Exceptional
98.2%
Scandinavians
100.0
/100
|
#29
Exceptional
98.2%
French Canadians
100.0
/100
|
#30
Exceptional
98.2%
Europeans
100.0
/100
|
#31
Exceptional
98.2%
Chippewa
100.0
/100
|
#32
Exceptional
98.1%

Demographics Similar to Immigrants from South Africa by 5th Grade

In terms of 5th grade, the demographic groups most similar to Immigrants from South Africa are Immigrants from Australia (97.8%, a difference of 0.0%), Shoshone (97.8%, a difference of 0.0%), Immigrants from Ireland (97.8%, a difference of 0.0%), Immigrants from Western Europe (97.8%, a difference of 0.0%), and Cypriot (97.8%, a difference of 0.010%).
DemographicsRating | Rank5th Grade
Pueblo
99.2
/100
|
#82
Exceptional
97.8%
Zimbabweans
99.0
/100
|
#83
Exceptional
97.8%
Potawatomi
99.0
/100
|
#84
Exceptional
97.8%
Immigrants | Belgium
99.0
/100
|
#85
Exceptional
97.8%
Cypriots
98.9
/100
|
#86
Exceptional
97.8%
Immigrants | Australia
98.8
/100
|
#87
Exceptional
97.8%
Shoshone
98.8
/100
|
#88
Exceptional
97.8%
Immigrants | South Africa
98.8
/100
|
#89
Exceptional
97.8%
Immigrants | Ireland
98.8
/100
|
#90
Exceptional
97.8%
Immigrants | Western Europe
98.8
/100
|
#91
Exceptional
97.8%
Immigrants | Sweden
98.7
/100
|
#92
Exceptional
97.8%
Delaware
98.6
/100
|
#93
Exceptional
97.8%
Immigrants | Denmark
98.6
/100
|
#94
Exceptional
97.8%
Romanians
98.6
/100
|
#95
Exceptional
97.8%
Immigrants | Germany
98.5
/100
|
#96
Exceptional
97.8%