Immigrants from Philippines vs Immigrants from Croatia Single Female Poverty
COMPARE
Immigrants from Philippines
Immigrants from Croatia
Single Female Poverty
Single Female Poverty Comparison
Immigrants from Philippines
Immigrants from Croatia
18.6%
SINGLE FEMALE POVERTY
99.9/ 100
METRIC RATING
33rd/ 347
METRIC RANK
18.9%
SINGLE FEMALE POVERTY
99.9/ 100
METRIC RATING
44th/ 347
METRIC RANK
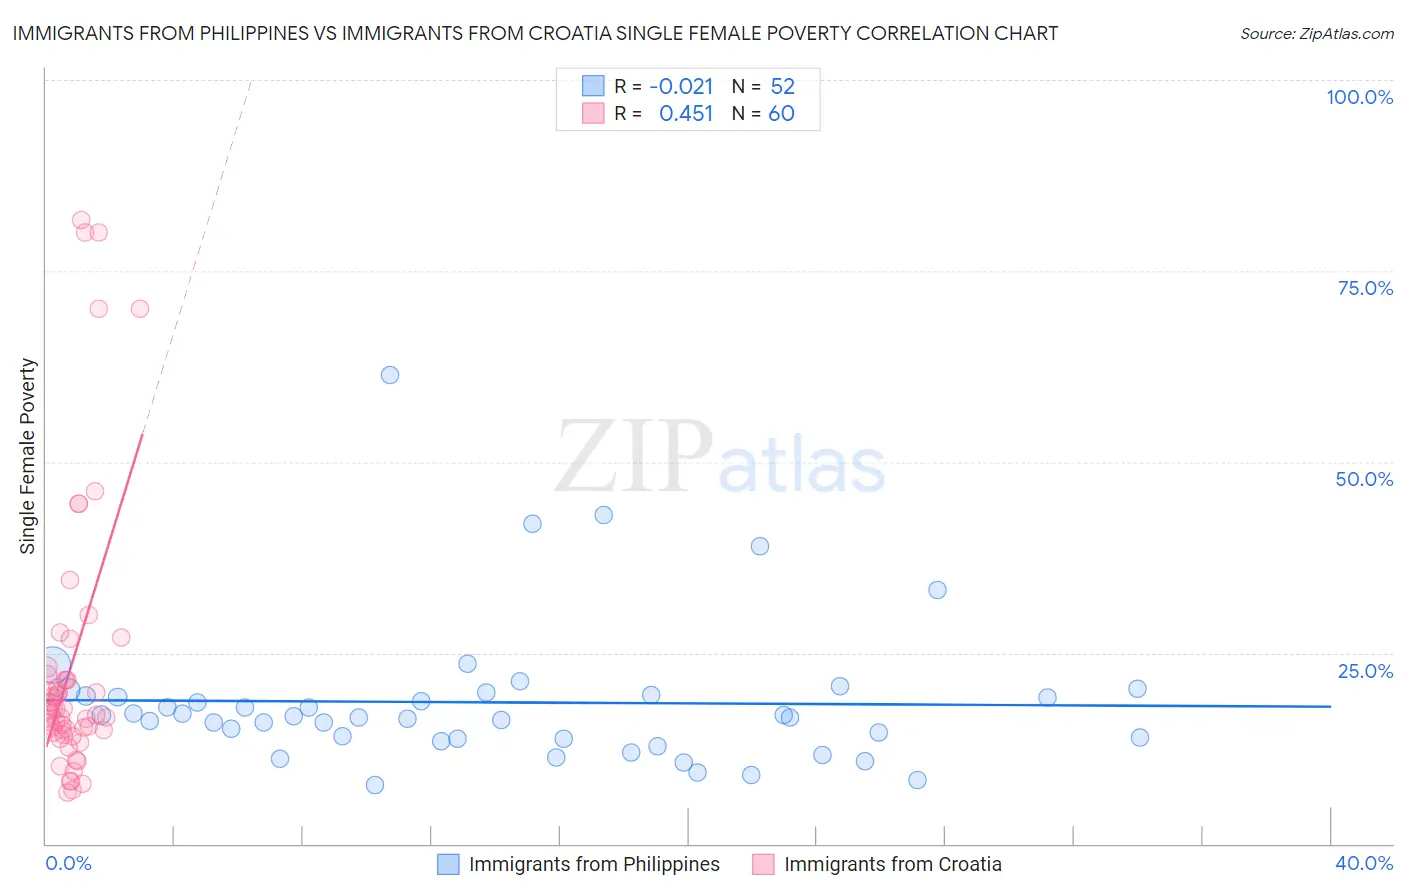
Immigrants from Philippines vs Immigrants from Croatia Single Female Poverty Correlation Chart
The statistical analysis conducted on geographies consisting of 462,433,577 people shows no correlation between the proportion of Immigrants from Philippines and poverty level among single females in the United States with a correlation coefficient (R) of -0.021 and weighted average of 18.6%. Similarly, the statistical analysis conducted on geographies consisting of 131,494,560 people shows a moderate positive correlation between the proportion of Immigrants from Croatia and poverty level among single females in the United States with a correlation coefficient (R) of 0.451 and weighted average of 18.9%, a difference of 1.6%.
Single Female Poverty Correlation Summary
| Measurement | Immigrants from Philippines | Immigrants from Croatia |
| Minimum | 7.7% | 6.7% |
| Maximum | 61.4% | 81.7% |
| Range | 53.7% | 74.9% |
| Mean | 18.5% | 23.4% |
| Median | 16.6% | 17.6% |
| Interquartile 25% (IQ1) | 13.8% | 14.7% |
| Interquartile 75% (IQ3) | 19.4% | 21.8% |
| Interquartile Range (IQR) | 5.6% | 7.1% |
| Standard Deviation (Sample) | 9.5% | 18.1% |
| Standard Deviation (Population) | 9.4% | 18.0% |
Demographics Similar to Immigrants from Philippines and Immigrants from Croatia by Single Female Poverty
In terms of single female poverty, the demographic groups most similar to Immigrants from Philippines are Immigrants from Sri Lanka (18.6%, a difference of 0.060%), Immigrants from Asia (18.6%, a difference of 0.15%), Korean (18.6%, a difference of 0.18%), Immigrants from North Macedonia (18.5%, a difference of 0.20%), and Immigrants from Japan (18.6%, a difference of 0.24%). Similarly, the demographic groups most similar to Immigrants from Croatia are Immigrants from Romania (18.8%, a difference of 0.17%), Immigrants from Indonesia (18.9%, a difference of 0.21%), Jordanian (18.8%, a difference of 0.32%), Macedonian (18.9%, a difference of 0.38%), and Immigrants from Serbia (18.8%, a difference of 0.40%).
| Demographics | Rating | Rank | Single Female Poverty |
| Immigrants | Moldova | 100.0 /100 | #28 | Exceptional 18.5% |
| Immigrants | Poland | 100.0 /100 | #29 | Exceptional 18.5% |
| Immigrants | North Macedonia | 99.9 /100 | #30 | Exceptional 18.5% |
| Immigrants | Asia | 99.9 /100 | #31 | Exceptional 18.6% |
| Immigrants | Sri Lanka | 99.9 /100 | #32 | Exceptional 18.6% |
| Immigrants | Philippines | 99.9 /100 | #33 | Exceptional 18.6% |
| Koreans | 99.9 /100 | #34 | Exceptional 18.6% |
| Immigrants | Japan | 99.9 /100 | #35 | Exceptional 18.6% |
| Turks | 99.9 /100 | #36 | Exceptional 18.7% |
| Immigrants | Armenia | 99.9 /100 | #37 | Exceptional 18.7% |
| Tongans | 99.9 /100 | #38 | Exceptional 18.8% |
| Bulgarians | 99.9 /100 | #39 | Exceptional 18.8% |
| Okinawans | 99.9 /100 | #40 | Exceptional 18.8% |
| Immigrants | Serbia | 99.9 /100 | #41 | Exceptional 18.8% |
| Jordanians | 99.9 /100 | #42 | Exceptional 18.8% |
| Immigrants | Romania | 99.9 /100 | #43 | Exceptional 18.8% |
| Immigrants | Croatia | 99.9 /100 | #44 | Exceptional 18.9% |
| Immigrants | Indonesia | 99.8 /100 | #45 | Exceptional 18.9% |
| Macedonians | 99.8 /100 | #46 | Exceptional 18.9% |
| Latvians | 99.8 /100 | #47 | Exceptional 19.0% |
| Immigrants | Argentina | 99.8 /100 | #48 | Exceptional 19.0% |