Yugoslavian vs Ecuadorian Associate's Degree
COMPARE
Yugoslavian
Ecuadorian
Associate's Degree
Associate's Degree Comparison
Yugoslavians
Ecuadorians
46.0%
ASSOCIATE'S DEGREE
40.2/ 100
METRIC RATING
183rd/ 347
METRIC RANK
43.0%
ASSOCIATE'S DEGREE
2.0/ 100
METRIC RATING
235th/ 347
METRIC RANK
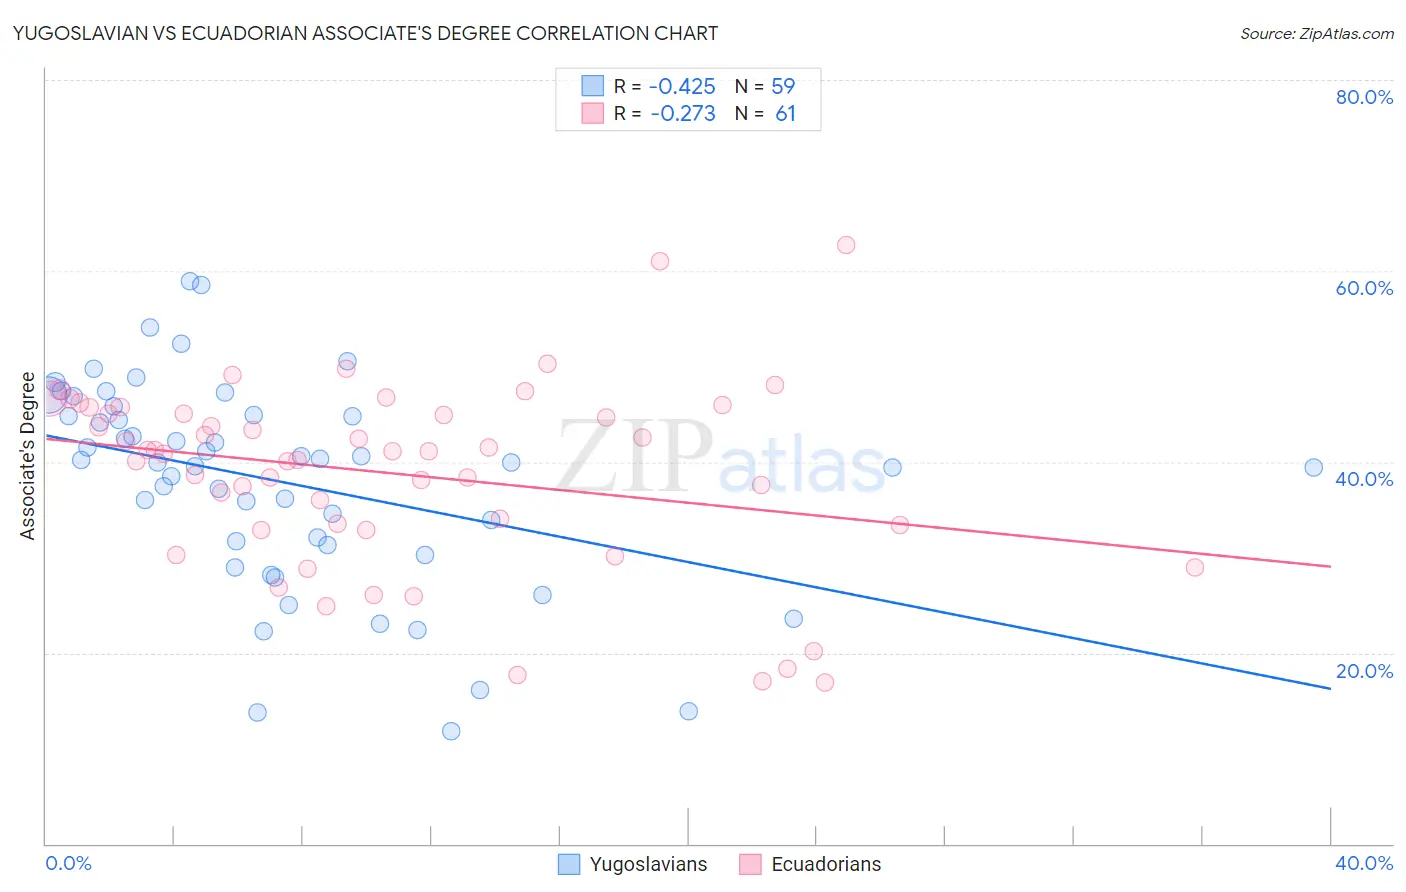
Yugoslavian vs Ecuadorian Associate's Degree Correlation Chart
The statistical analysis conducted on geographies consisting of 285,717,072 people shows a moderate negative correlation between the proportion of Yugoslavians and percentage of population with at least associate's degree education in the United States with a correlation coefficient (R) of -0.425 and weighted average of 46.0%. Similarly, the statistical analysis conducted on geographies consisting of 317,844,783 people shows a weak negative correlation between the proportion of Ecuadorians and percentage of population with at least associate's degree education in the United States with a correlation coefficient (R) of -0.273 and weighted average of 43.0%, a difference of 7.1%.
Associate's Degree Correlation Summary
| Measurement | Yugoslavian | Ecuadorian |
| Minimum | 11.8% | 16.9% |
| Maximum | 58.9% | 62.8% |
| Range | 47.2% | 45.8% |
| Mean | 37.9% | 38.8% |
| Median | 40.0% | 41.1% |
| Interquartile 25% (IQ1) | 31.3% | 33.1% |
| Interquartile 75% (IQ3) | 44.9% | 45.4% |
| Interquartile Range (IQR) | 13.6% | 12.3% |
| Standard Deviation (Sample) | 10.8% | 9.7% |
| Standard Deviation (Population) | 10.7% | 9.7% |
Similar Demographics by Associate's Degree
Demographics Similar to Yugoslavians by Associate's Degree
In terms of associate's degree, the demographic groups most similar to Yugoslavians are Swiss (46.0%, a difference of 0.010%), Czechoslovakian (46.0%, a difference of 0.020%), Immigrants from Colombia (46.0%, a difference of 0.080%), Costa Rican (46.0%, a difference of 0.13%), and Welsh (45.9%, a difference of 0.19%).
| Demographics | Rating | Rank | Associate's Degree |
| Finns | 48.5 /100 | #176 | Average 46.3% |
| Slovaks | 48.4 /100 | #177 | Average 46.3% |
| Immigrants | Bosnia and Herzegovina | 48.3 /100 | #178 | Average 46.3% |
| Sri Lankans | 47.6 /100 | #179 | Average 46.3% |
| Bermudans | 46.4 /100 | #180 | Average 46.2% |
| Immigrants | Colombia | 41.3 /100 | #181 | Average 46.0% |
| Swiss | 40.4 /100 | #182 | Average 46.0% |
| Yugoslavians | 40.2 /100 | #183 | Average 46.0% |
| Czechoslovakians | 40.0 /100 | #184 | Average 46.0% |
| Costa Ricans | 38.6 /100 | #185 | Fair 46.0% |
| Welsh | 37.9 /100 | #186 | Fair 45.9% |
| Immigrants | Uruguay | 35.5 /100 | #187 | Fair 45.8% |
| Ghanaians | 35.5 /100 | #188 | Fair 45.8% |
| Immigrants | Oceania | 34.7 /100 | #189 | Fair 45.8% |
| Vietnamese | 34.0 /100 | #190 | Fair 45.8% |
Demographics Similar to Ecuadorians by Associate's Degree
In terms of associate's degree, the demographic groups most similar to Ecuadorians are Immigrants from St. Vincent and the Grenadines (42.9%, a difference of 0.080%), Tlingit-Haida (43.0%, a difference of 0.090%), Nonimmigrants (42.9%, a difference of 0.10%), Tongan (43.0%, a difference of 0.19%), and Native Hawaiian (43.1%, a difference of 0.35%).
| Demographics | Rating | Rank | Associate's Degree |
| Hmong | 3.2 /100 | #228 | Tragic 43.4% |
| Immigrants | Trinidad and Tobago | 3.0 /100 | #229 | Tragic 43.3% |
| Immigrants | Barbados | 2.9 /100 | #230 | Tragic 43.3% |
| Liberians | 2.9 /100 | #231 | Tragic 43.3% |
| Native Hawaiians | 2.3 /100 | #232 | Tragic 43.1% |
| Tongans | 2.2 /100 | #233 | Tragic 43.0% |
| Tlingit-Haida | 2.1 /100 | #234 | Tragic 43.0% |
| Ecuadorians | 2.0 /100 | #235 | Tragic 43.0% |
| Immigrants | St. Vincent and the Grenadines | 1.9 /100 | #236 | Tragic 42.9% |
| Immigrants | Nonimmigrants | 1.9 /100 | #237 | Tragic 42.9% |
| Iroquois | 1.7 /100 | #238 | Tragic 42.8% |
| Immigrants | Grenada | 1.3 /100 | #239 | Tragic 42.6% |
| Cree | 1.2 /100 | #240 | Tragic 42.5% |
| British West Indians | 1.0 /100 | #241 | Tragic 42.4% |
| Immigrants | West Indies | 1.0 /100 | #242 | Tragic 42.4% |