Arapaho vs Ecuadorian Female Poverty
COMPARE
Arapaho
Ecuadorian
Female Poverty
Female Poverty Comparison
Arapaho
Ecuadorians
17.5%
FEMALE POVERTY
0.0/ 100
METRIC RATING
321st/ 347
METRIC RANK
15.3%
FEMALE POVERTY
0.3/ 100
METRIC RATING
244th/ 347
METRIC RANK
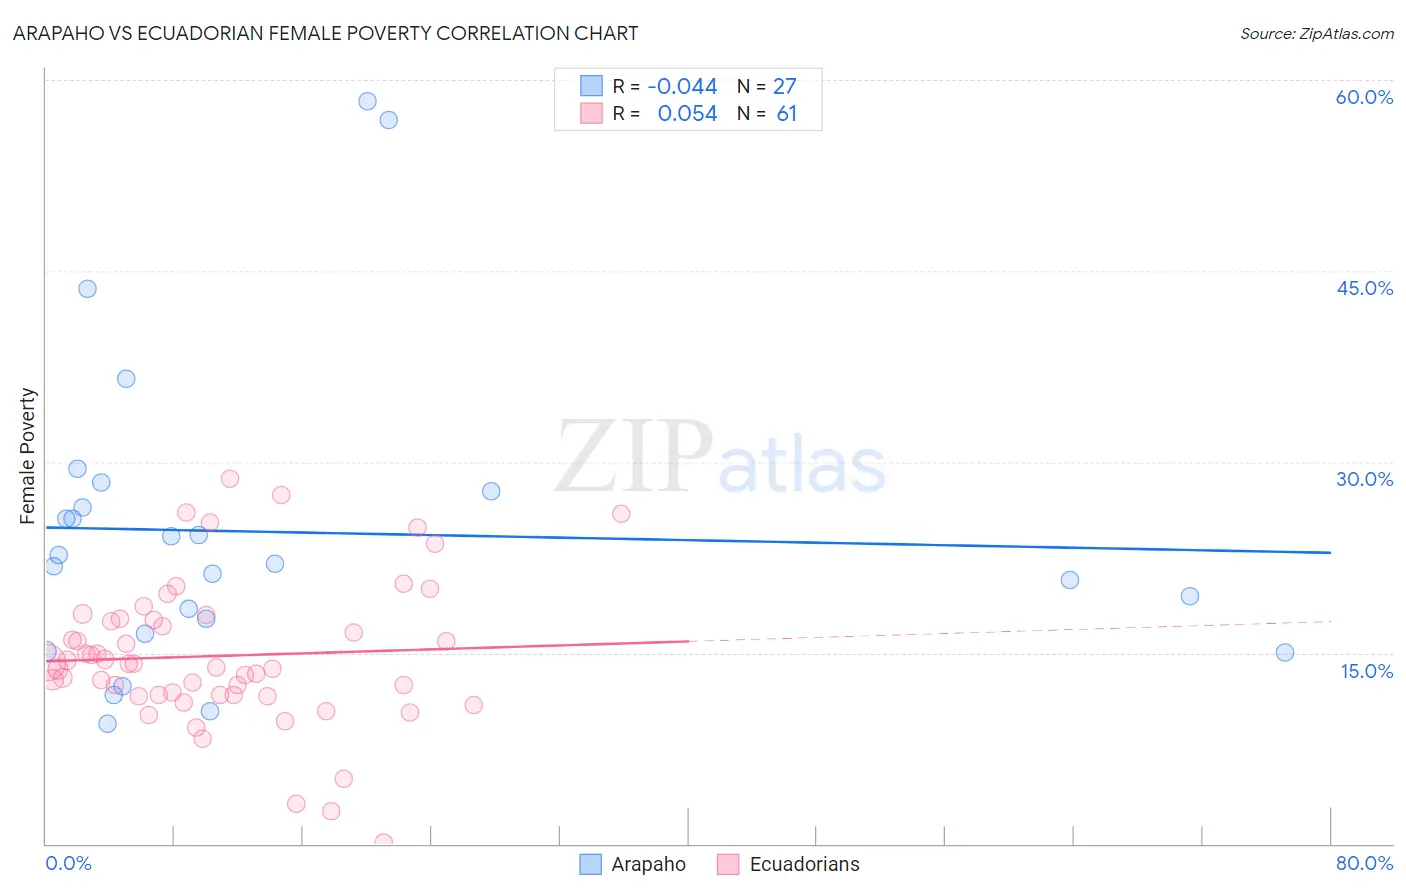
Arapaho vs Ecuadorian Female Poverty Correlation Chart
The statistical analysis conducted on geographies consisting of 29,777,916 people shows no correlation between the proportion of Arapaho and poverty level among females in the United States with a correlation coefficient (R) of -0.044 and weighted average of 17.5%. Similarly, the statistical analysis conducted on geographies consisting of 317,585,196 people shows a slight positive correlation between the proportion of Ecuadorians and poverty level among females in the United States with a correlation coefficient (R) of 0.054 and weighted average of 15.3%, a difference of 14.4%.
Female Poverty Correlation Summary
| Measurement | Arapaho | Ecuadorian |
| Minimum | 9.4% | 0.14% |
| Maximum | 58.3% | 28.7% |
| Range | 48.9% | 28.5% |
| Mean | 24.5% | 14.8% |
| Median | 22.0% | 14.1% |
| Interquartile 25% (IQ1) | 16.5% | 11.7% |
| Interquartile 75% (IQ3) | 27.7% | 17.6% |
| Interquartile Range (IQR) | 11.2% | 5.9% |
| Standard Deviation (Sample) | 12.2% | 5.7% |
| Standard Deviation (Population) | 12.0% | 5.7% |
Similar Demographics by Female Poverty
Demographics Similar to Arapaho by Female Poverty
In terms of female poverty, the demographic groups most similar to Arapaho are Immigrants from Dominica (17.5%, a difference of 0.060%), Cajun (17.5%, a difference of 0.15%), Ute (17.5%, a difference of 0.16%), Immigrants from Congo (17.4%, a difference of 0.48%), and Menominee (17.6%, a difference of 0.65%).
| Demographics | Rating | Rank | Female Poverty |
| Dutch West Indians | 0.0 /100 | #314 | Tragic 17.1% |
| U.S. Virgin Islanders | 0.0 /100 | #315 | Tragic 17.3% |
| Hondurans | 0.0 /100 | #316 | Tragic 17.4% |
| Immigrants | Congo | 0.0 /100 | #317 | Tragic 17.4% |
| Ute | 0.0 /100 | #318 | Tragic 17.5% |
| Cajuns | 0.0 /100 | #319 | Tragic 17.5% |
| Immigrants | Dominica | 0.0 /100 | #320 | Tragic 17.5% |
| Arapaho | 0.0 /100 | #321 | Tragic 17.5% |
| Menominee | 0.0 /100 | #322 | Tragic 17.6% |
| Paiute | 0.0 /100 | #323 | Tragic 17.7% |
| Immigrants | Honduras | 0.0 /100 | #324 | Tragic 17.7% |
| Colville | 0.0 /100 | #325 | Tragic 17.8% |
| Central American Indians | 0.0 /100 | #326 | Tragic 18.0% |
| Yakama | 0.0 /100 | #327 | Tragic 18.0% |
| Blacks/African Americans | 0.0 /100 | #328 | Tragic 18.6% |
Demographics Similar to Ecuadorians by Female Poverty
In terms of female poverty, the demographic groups most similar to Ecuadorians are Nicaraguan (15.3%, a difference of 0.050%), Spanish American Indian (15.3%, a difference of 0.090%), Cuban (15.3%, a difference of 0.15%), Potawatomi (15.3%, a difference of 0.16%), and Immigrants from Ghana (15.3%, a difference of 0.16%).
| Demographics | Rating | Rank | Female Poverty |
| French American Indians | 0.6 /100 | #237 | Tragic 15.1% |
| Immigrants | Armenia | 0.6 /100 | #238 | Tragic 15.1% |
| Immigrants | Middle Africa | 0.5 /100 | #239 | Tragic 15.2% |
| Sudanese | 0.5 /100 | #240 | Tragic 15.2% |
| Immigrants | Sudan | 0.4 /100 | #241 | Tragic 15.2% |
| Nepalese | 0.4 /100 | #242 | Tragic 15.2% |
| Nicaraguans | 0.3 /100 | #243 | Tragic 15.3% |
| Ecuadorians | 0.3 /100 | #244 | Tragic 15.3% |
| Spanish American Indians | 0.3 /100 | #245 | Tragic 15.3% |
| Cubans | 0.3 /100 | #246 | Tragic 15.3% |
| Potawatomi | 0.3 /100 | #247 | Tragic 15.3% |
| Immigrants | Ghana | 0.3 /100 | #248 | Tragic 15.3% |
| Salvadorans | 0.3 /100 | #249 | Tragic 15.3% |
| Immigrants | Western Africa | 0.3 /100 | #250 | Tragic 15.3% |
| Immigrants | Trinidad and Tobago | 0.3 /100 | #251 | Tragic 15.4% |