Yakama vs Dominican Single Female Poverty
COMPARE
Yakama
Dominican
Single Female Poverty
Single Female Poverty Comparison
Yakama
Dominicans
28.3%
SINGLE FEMALE POVERTY
0.0/ 100
METRIC RATING
332nd/ 347
METRIC RANK
25.4%
SINGLE FEMALE POVERTY
0.0/ 100
METRIC RATING
309th/ 347
METRIC RANK
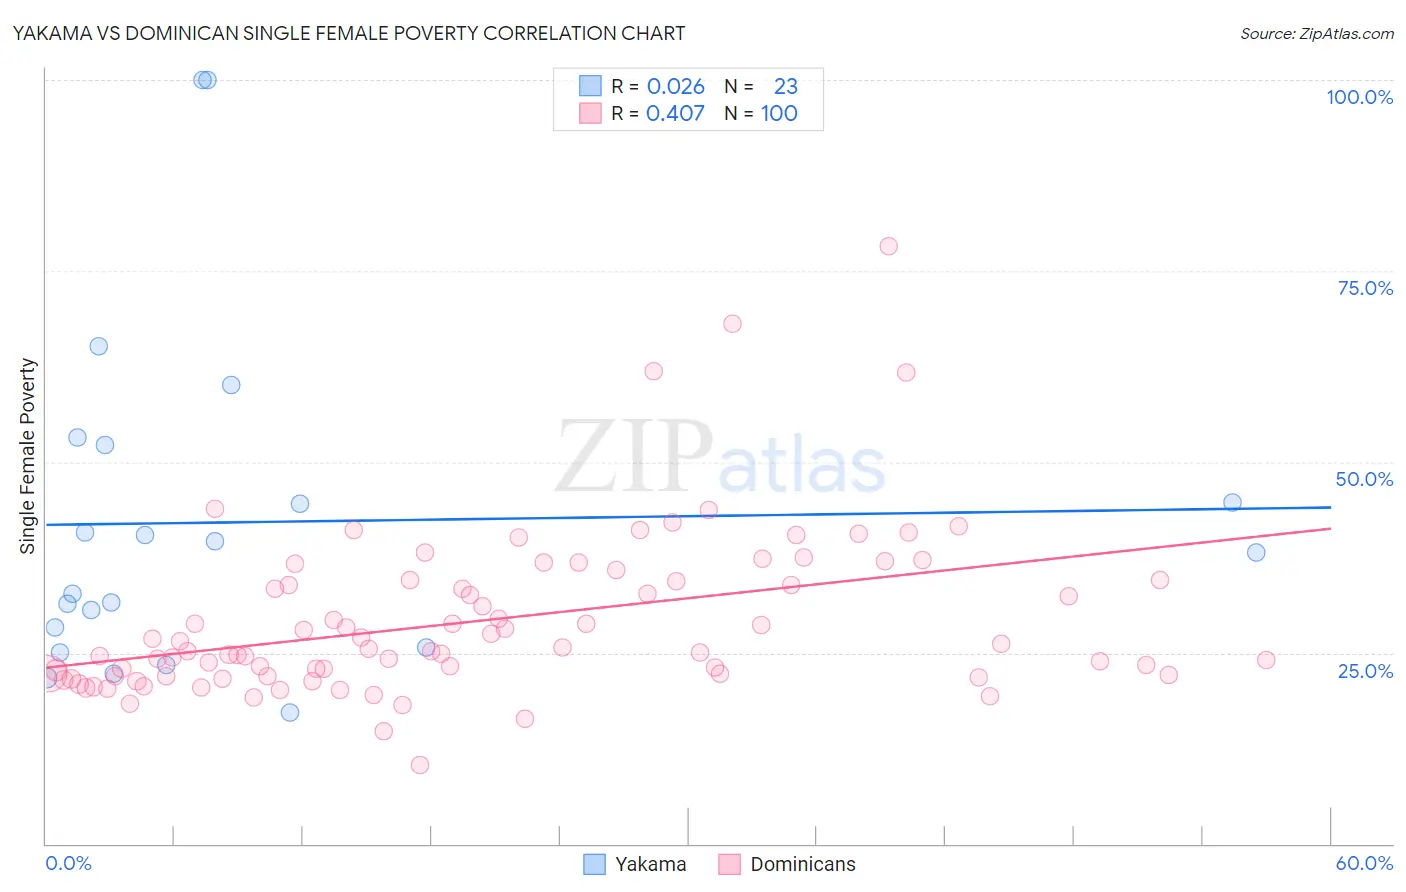
Yakama vs Dominican Single Female Poverty Correlation Chart
The statistical analysis conducted on geographies consisting of 19,831,112 people shows no correlation between the proportion of Yakama and poverty level among single females in the United States with a correlation coefficient (R) of 0.026 and weighted average of 28.3%. Similarly, the statistical analysis conducted on geographies consisting of 349,852,578 people shows a moderate positive correlation between the proportion of Dominicans and poverty level among single females in the United States with a correlation coefficient (R) of 0.407 and weighted average of 25.4%, a difference of 11.3%.
Single Female Poverty Correlation Summary
| Measurement | Yakama | Dominican |
| Minimum | 17.1% | 10.3% |
| Maximum | 100.0% | 78.2% |
| Range | 82.9% | 67.9% |
| Mean | 42.1% | 29.2% |
| Median | 38.2% | 25.3% |
| Interquartile 25% (IQ1) | 25.8% | 22.1% |
| Interquartile 75% (IQ3) | 52.2% | 34.4% |
| Interquartile Range (IQR) | 26.4% | 12.4% |
| Standard Deviation (Sample) | 22.2% | 10.8% |
| Standard Deviation (Population) | 21.7% | 10.7% |
Similar Demographics by Single Female Poverty
Demographics Similar to Yakama by Single Female Poverty
In terms of single female poverty, the demographic groups most similar to Yakama are Native/Alaskan (28.2%, a difference of 0.26%), Ute (28.4%, a difference of 0.42%), Hopi (28.0%, a difference of 0.90%), Pueblo (28.6%, a difference of 1.1%), and Menominee (27.8%, a difference of 1.6%).
| Demographics | Rating | Rank | Single Female Poverty |
| Choctaw | 0.0 /100 | #325 | Tragic 27.2% |
| Creek | 0.0 /100 | #326 | Tragic 27.4% |
| Dutch West Indians | 0.0 /100 | #327 | Tragic 27.5% |
| Apache | 0.0 /100 | #328 | Tragic 27.7% |
| Menominee | 0.0 /100 | #329 | Tragic 27.8% |
| Hopi | 0.0 /100 | #330 | Tragic 28.0% |
| Natives/Alaskans | 0.0 /100 | #331 | Tragic 28.2% |
| Yakama | 0.0 /100 | #332 | Tragic 28.3% |
| Ute | 0.0 /100 | #333 | Tragic 28.4% |
| Pueblo | 0.0 /100 | #334 | Tragic 28.6% |
| Immigrants | Yemen | 0.0 /100 | #335 | Tragic 28.9% |
| Colville | 0.0 /100 | #336 | Tragic 29.1% |
| Yuman | 0.0 /100 | #337 | Tragic 29.4% |
| Pima | 0.0 /100 | #338 | Tragic 30.3% |
| Cheyenne | 0.0 /100 | #339 | Tragic 30.4% |
Demographics Similar to Dominicans by Single Female Poverty
In terms of single female poverty, the demographic groups most similar to Dominicans are Aleut (25.4%, a difference of 0.010%), Central American Indian (25.5%, a difference of 0.15%), Potawatomi (25.4%, a difference of 0.18%), Immigrants from Mexico (25.3%, a difference of 0.41%), and Immigrants from Honduras (25.5%, a difference of 0.43%).
| Demographics | Rating | Rank | Single Female Poverty |
| Shoshone | 0.0 /100 | #302 | Tragic 25.1% |
| Somalis | 0.0 /100 | #303 | Tragic 25.2% |
| Immigrants | Congo | 0.0 /100 | #304 | Tragic 25.3% |
| Immigrants | Dominican Republic | 0.0 /100 | #305 | Tragic 25.3% |
| Immigrants | Mexico | 0.0 /100 | #306 | Tragic 25.3% |
| Potawatomi | 0.0 /100 | #307 | Tragic 25.4% |
| Aleuts | 0.0 /100 | #308 | Tragic 25.4% |
| Dominicans | 0.0 /100 | #309 | Tragic 25.4% |
| Central American Indians | 0.0 /100 | #310 | Tragic 25.5% |
| Immigrants | Honduras | 0.0 /100 | #311 | Tragic 25.5% |
| Paiute | 0.0 /100 | #312 | Tragic 25.5% |
| Comanche | 0.0 /100 | #313 | Tragic 25.6% |
| Cherokee | 0.0 /100 | #314 | Tragic 25.7% |
| Iroquois | 0.0 /100 | #315 | Tragic 25.7% |
| Immigrants | Somalia | 0.0 /100 | #316 | Tragic 25.8% |