Yakama vs Navajo Single Female Poverty
COMPARE
Yakama
Navajo
Single Female Poverty
Single Female Poverty Comparison
Yakama
Navajo
28.3%
SINGLE FEMALE POVERTY
0.0/ 100
METRIC RATING
332nd/ 347
METRIC RANK
31.7%
SINGLE FEMALE POVERTY
0.0/ 100
METRIC RATING
342nd/ 347
METRIC RANK
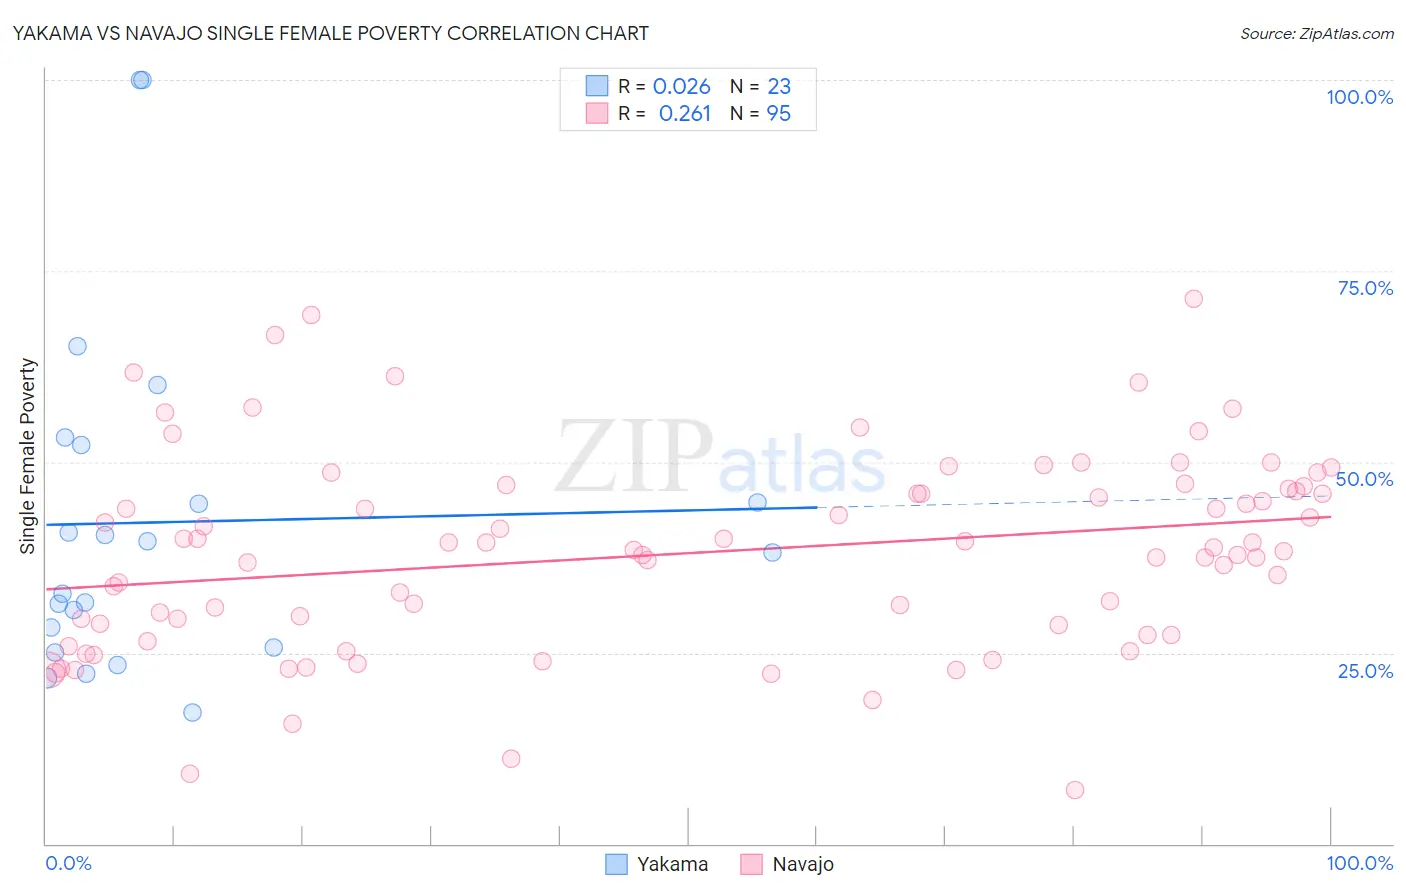
Yakama vs Navajo Single Female Poverty Correlation Chart
The statistical analysis conducted on geographies consisting of 19,831,112 people shows no correlation between the proportion of Yakama and poverty level among single females in the United States with a correlation coefficient (R) of 0.026 and weighted average of 28.3%. Similarly, the statistical analysis conducted on geographies consisting of 223,343,663 people shows a weak positive correlation between the proportion of Navajo and poverty level among single females in the United States with a correlation coefficient (R) of 0.261 and weighted average of 31.7%, a difference of 11.9%.
Single Female Poverty Correlation Summary
| Measurement | Yakama | Navajo |
| Minimum | 17.1% | 7.0% |
| Maximum | 100.0% | 71.4% |
| Range | 82.9% | 64.4% |
| Mean | 42.1% | 38.1% |
| Median | 38.2% | 38.5% |
| Interquartile 25% (IQ1) | 25.8% | 27.3% |
| Interquartile 75% (IQ3) | 52.2% | 46.5% |
| Interquartile Range (IQR) | 26.4% | 19.3% |
| Standard Deviation (Sample) | 22.2% | 13.1% |
| Standard Deviation (Population) | 21.7% | 13.0% |
Demographics Similar to Yakama and Navajo by Single Female Poverty
In terms of single female poverty, the demographic groups most similar to Yakama are Native/Alaskan (28.2%, a difference of 0.26%), Ute (28.4%, a difference of 0.42%), Hopi (28.0%, a difference of 0.90%), Pueblo (28.6%, a difference of 1.1%), and Menominee (27.8%, a difference of 1.6%). Similarly, the demographic groups most similar to Navajo are Sioux (31.3%, a difference of 1.3%), Crow (32.4%, a difference of 2.4%), Cajun (30.6%, a difference of 3.3%), Cheyenne (30.4%, a difference of 4.1%), and Lumbee (33.0%, a difference of 4.3%).
| Demographics | Rating | Rank | Single Female Poverty |
| Dutch West Indians | 0.0 /100 | #327 | Tragic 27.5% |
| Apache | 0.0 /100 | #328 | Tragic 27.7% |
| Menominee | 0.0 /100 | #329 | Tragic 27.8% |
| Hopi | 0.0 /100 | #330 | Tragic 28.0% |
| Natives/Alaskans | 0.0 /100 | #331 | Tragic 28.2% |
| Yakama | 0.0 /100 | #332 | Tragic 28.3% |
| Ute | 0.0 /100 | #333 | Tragic 28.4% |
| Pueblo | 0.0 /100 | #334 | Tragic 28.6% |
| Immigrants | Yemen | 0.0 /100 | #335 | Tragic 28.9% |
| Colville | 0.0 /100 | #336 | Tragic 29.1% |
| Yuman | 0.0 /100 | #337 | Tragic 29.4% |
| Pima | 0.0 /100 | #338 | Tragic 30.3% |
| Cheyenne | 0.0 /100 | #339 | Tragic 30.4% |
| Cajuns | 0.0 /100 | #340 | Tragic 30.6% |
| Sioux | 0.0 /100 | #341 | Tragic 31.3% |
| Navajo | 0.0 /100 | #342 | Tragic 31.7% |
| Crow | 0.0 /100 | #343 | Tragic 32.4% |
| Lumbee | 0.0 /100 | #344 | Tragic 33.0% |
| Houma | 0.0 /100 | #345 | Tragic 33.8% |
| Puerto Ricans | 0.0 /100 | #346 | Tragic 34.1% |
| Tohono O'odham | 0.0 /100 | #347 | Tragic 34.2% |