Yakama vs Immigrants from Grenada Single Female Poverty
COMPARE
Yakama
Immigrants from Grenada
Single Female Poverty
Single Female Poverty Comparison
Yakama
Immigrants from Grenada
28.3%
SINGLE FEMALE POVERTY
0.0/ 100
METRIC RATING
332nd/ 347
METRIC RANK
21.8%
SINGLE FEMALE POVERTY
8.0/ 100
METRIC RATING
221st/ 347
METRIC RANK
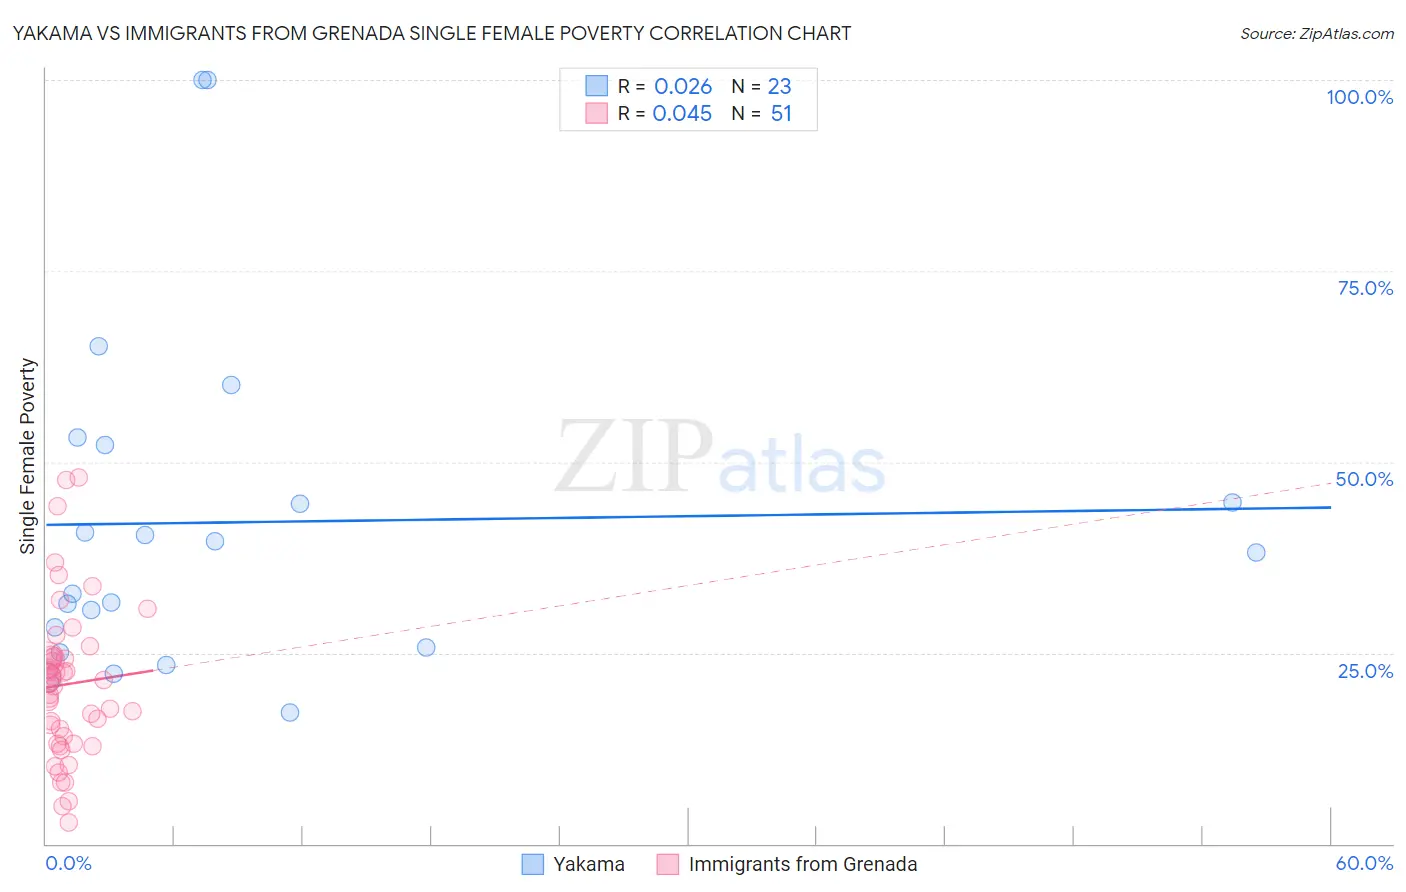
Yakama vs Immigrants from Grenada Single Female Poverty Correlation Chart
The statistical analysis conducted on geographies consisting of 19,831,112 people shows no correlation between the proportion of Yakama and poverty level among single females in the United States with a correlation coefficient (R) of 0.026 and weighted average of 28.3%. Similarly, the statistical analysis conducted on geographies consisting of 66,935,343 people shows no correlation between the proportion of Immigrants from Grenada and poverty level among single females in the United States with a correlation coefficient (R) of 0.045 and weighted average of 21.8%, a difference of 29.7%.
Single Female Poverty Correlation Summary
| Measurement | Yakama | Immigrants from Grenada |
| Minimum | 17.1% | 2.9% |
| Maximum | 100.0% | 47.9% |
| Range | 82.9% | 45.1% |
| Mean | 42.1% | 20.9% |
| Median | 38.2% | 21.0% |
| Interquartile 25% (IQ1) | 25.8% | 13.2% |
| Interquartile 75% (IQ3) | 52.2% | 24.4% |
| Interquartile Range (IQR) | 26.4% | 11.3% |
| Standard Deviation (Sample) | 22.2% | 10.1% |
| Standard Deviation (Population) | 21.7% | 10.0% |
Similar Demographics by Single Female Poverty
Demographics Similar to Yakama by Single Female Poverty
In terms of single female poverty, the demographic groups most similar to Yakama are Native/Alaskan (28.2%, a difference of 0.26%), Ute (28.4%, a difference of 0.42%), Hopi (28.0%, a difference of 0.90%), Pueblo (28.6%, a difference of 1.1%), and Menominee (27.8%, a difference of 1.6%).
| Demographics | Rating | Rank | Single Female Poverty |
| Choctaw | 0.0 /100 | #325 | Tragic 27.2% |
| Creek | 0.0 /100 | #326 | Tragic 27.4% |
| Dutch West Indians | 0.0 /100 | #327 | Tragic 27.5% |
| Apache | 0.0 /100 | #328 | Tragic 27.7% |
| Menominee | 0.0 /100 | #329 | Tragic 27.8% |
| Hopi | 0.0 /100 | #330 | Tragic 28.0% |
| Natives/Alaskans | 0.0 /100 | #331 | Tragic 28.2% |
| Yakama | 0.0 /100 | #332 | Tragic 28.3% |
| Ute | 0.0 /100 | #333 | Tragic 28.4% |
| Pueblo | 0.0 /100 | #334 | Tragic 28.6% |
| Immigrants | Yemen | 0.0 /100 | #335 | Tragic 28.9% |
| Colville | 0.0 /100 | #336 | Tragic 29.1% |
| Yuman | 0.0 /100 | #337 | Tragic 29.4% |
| Pima | 0.0 /100 | #338 | Tragic 30.3% |
| Cheyenne | 0.0 /100 | #339 | Tragic 30.4% |
Demographics Similar to Immigrants from Grenada by Single Female Poverty
In terms of single female poverty, the demographic groups most similar to Immigrants from Grenada are Immigrants from Eritrea (21.8%, a difference of 0.010%), German (21.8%, a difference of 0.050%), Scottish (21.8%, a difference of 0.15%), Barbadian (21.8%, a difference of 0.17%), and Panamanian (21.7%, a difference of 0.26%).
| Demographics | Rating | Rank | Single Female Poverty |
| Immigrants | Nicaragua | 13.3 /100 | #214 | Poor 21.6% |
| Ecuadorians | 12.3 /100 | #215 | Poor 21.6% |
| Immigrants | Barbados | 12.2 /100 | #216 | Poor 21.7% |
| Immigrants | St. Vincent and the Grenadines | 11.7 /100 | #217 | Poor 21.7% |
| Nepalese | 9.7 /100 | #218 | Tragic 21.7% |
| Panamanians | 9.4 /100 | #219 | Tragic 21.7% |
| Germans | 8.3 /100 | #220 | Tragic 21.8% |
| Immigrants | Grenada | 8.0 /100 | #221 | Tragic 21.8% |
| Immigrants | Eritrea | 7.9 /100 | #222 | Tragic 21.8% |
| Scottish | 7.3 /100 | #223 | Tragic 21.8% |
| Barbadians | 7.2 /100 | #224 | Tragic 21.8% |
| English | 6.4 /100 | #225 | Tragic 21.9% |
| Immigrants | Portugal | 5.8 /100 | #226 | Tragic 21.9% |
| Immigrants | Ghana | 5.8 /100 | #227 | Tragic 21.9% |
| Salvadorans | 5.5 /100 | #228 | Tragic 21.9% |