Indonesian vs Dominican Single Female Poverty
COMPARE
Indonesian
Dominican
Single Female Poverty
Single Female Poverty Comparison
Indonesians
Dominicans
24.3%
SINGLE FEMALE POVERTY
0.0/ 100
METRIC RATING
290th/ 347
METRIC RANK
25.4%
SINGLE FEMALE POVERTY
0.0/ 100
METRIC RATING
309th/ 347
METRIC RANK
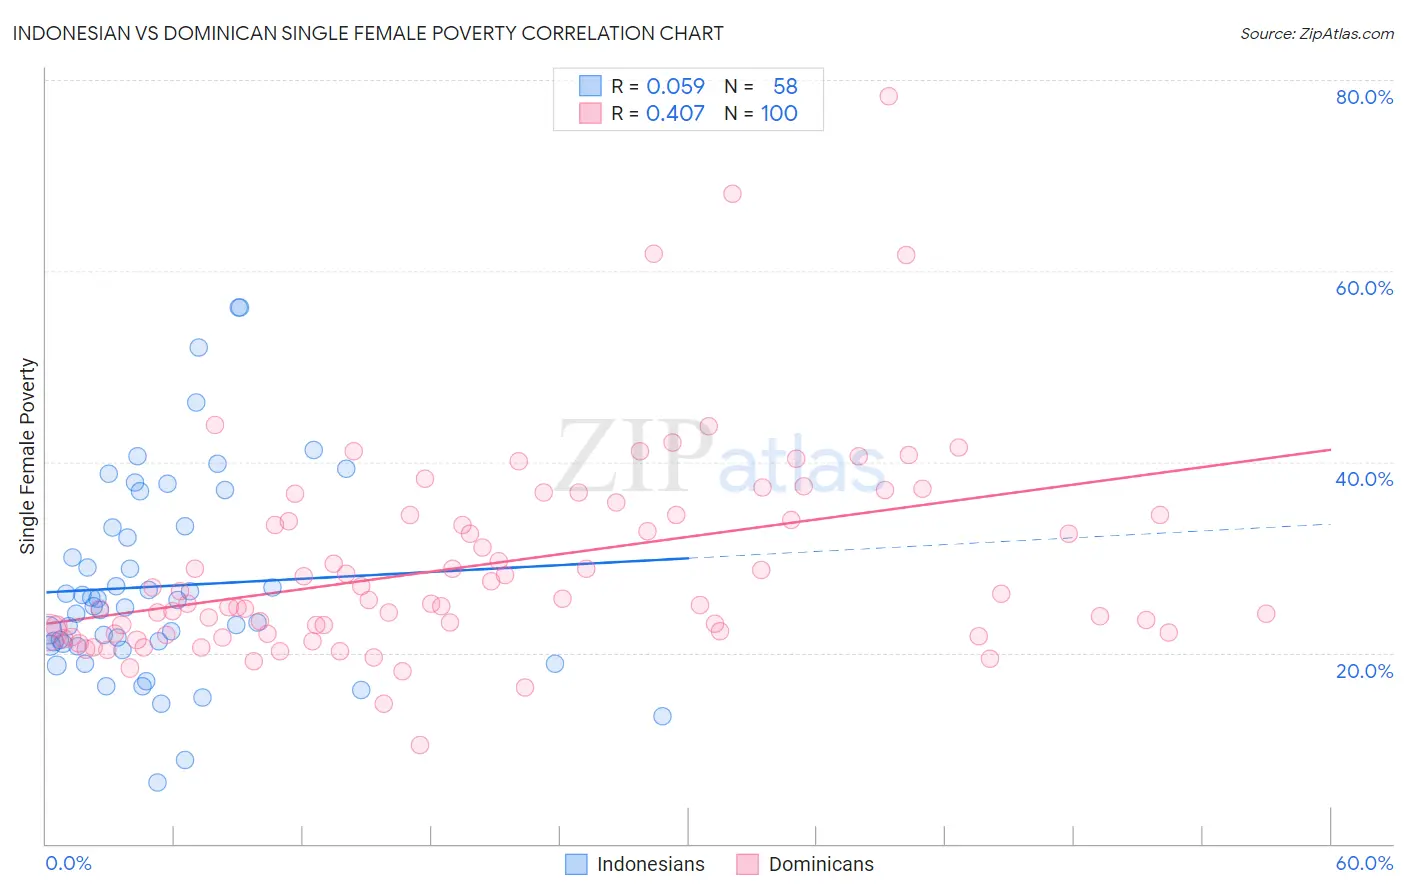
Indonesian vs Dominican Single Female Poverty Correlation Chart
The statistical analysis conducted on geographies consisting of 161,765,451 people shows a slight positive correlation between the proportion of Indonesians and poverty level among single females in the United States with a correlation coefficient (R) of 0.059 and weighted average of 24.3%. Similarly, the statistical analysis conducted on geographies consisting of 349,852,578 people shows a moderate positive correlation between the proportion of Dominicans and poverty level among single females in the United States with a correlation coefficient (R) of 0.407 and weighted average of 25.4%, a difference of 4.8%.
Single Female Poverty Correlation Summary
| Measurement | Indonesian | Dominican |
| Minimum | 6.4% | 10.3% |
| Maximum | 56.2% | 78.2% |
| Range | 49.8% | 67.9% |
| Mean | 27.0% | 29.2% |
| Median | 24.8% | 25.3% |
| Interquartile 25% (IQ1) | 20.8% | 22.1% |
| Interquartile 75% (IQ3) | 33.1% | 34.4% |
| Interquartile Range (IQR) | 12.3% | 12.4% |
| Standard Deviation (Sample) | 10.6% | 10.8% |
| Standard Deviation (Population) | 10.5% | 10.7% |
Demographics Similar to Indonesians and Dominicans by Single Female Poverty
In terms of single female poverty, the demographic groups most similar to Indonesians are U.S. Virgin Islander (24.2%, a difference of 0.34%), Osage (24.4%, a difference of 0.60%), Alsatian (24.5%, a difference of 0.97%), American (24.5%, a difference of 1.0%), and French American Indian (24.6%, a difference of 1.2%). Similarly, the demographic groups most similar to Dominicans are Aleut (25.4%, a difference of 0.010%), Potawatomi (25.4%, a difference of 0.18%), Immigrants from Mexico (25.3%, a difference of 0.41%), Immigrants from Dominican Republic (25.3%, a difference of 0.50%), and Immigrants from Congo (25.3%, a difference of 0.52%).
| Demographics | Rating | Rank | Single Female Poverty |
| U.S. Virgin Islanders | 0.0 /100 | #289 | Tragic 24.2% |
| Indonesians | 0.0 /100 | #290 | Tragic 24.3% |
| Osage | 0.0 /100 | #291 | Tragic 24.4% |
| Alsatians | 0.0 /100 | #292 | Tragic 24.5% |
| Americans | 0.0 /100 | #293 | Tragic 24.5% |
| French American Indians | 0.0 /100 | #294 | Tragic 24.6% |
| Hispanics or Latinos | 0.0 /100 | #295 | Tragic 24.6% |
| Africans | 0.0 /100 | #296 | Tragic 24.8% |
| Immigrants | Central America | 0.0 /100 | #297 | Tragic 24.8% |
| Yaqui | 0.0 /100 | #298 | Tragic 24.9% |
| Mexicans | 0.0 /100 | #299 | Tragic 25.0% |
| Blackfeet | 0.0 /100 | #300 | Tragic 25.1% |
| Hondurans | 0.0 /100 | #301 | Tragic 25.1% |
| Shoshone | 0.0 /100 | #302 | Tragic 25.1% |
| Somalis | 0.0 /100 | #303 | Tragic 25.2% |
| Immigrants | Congo | 0.0 /100 | #304 | Tragic 25.3% |
| Immigrants | Dominican Republic | 0.0 /100 | #305 | Tragic 25.3% |
| Immigrants | Mexico | 0.0 /100 | #306 | Tragic 25.3% |
| Potawatomi | 0.0 /100 | #307 | Tragic 25.4% |
| Aleuts | 0.0 /100 | #308 | Tragic 25.4% |
| Dominicans | 0.0 /100 | #309 | Tragic 25.4% |