White/Caucasian vs Crow Child Poverty Among Girls Under 16
COMPARE
White/Caucasian
Crow
Child Poverty Among Girls Under 16
Child Poverty Among Girls Under 16 Comparison
Whites/Caucasians
Crow
16.6%
CHILD POVERTY AMONG GIRLS UNDER 16
43.6/ 100
METRIC RATING
178th/ 347
METRIC RANK
26.4%
CHILD POVERTY AMONG GIRLS UNDER 16
0.0/ 100
METRIC RATING
339th/ 347
METRIC RANK
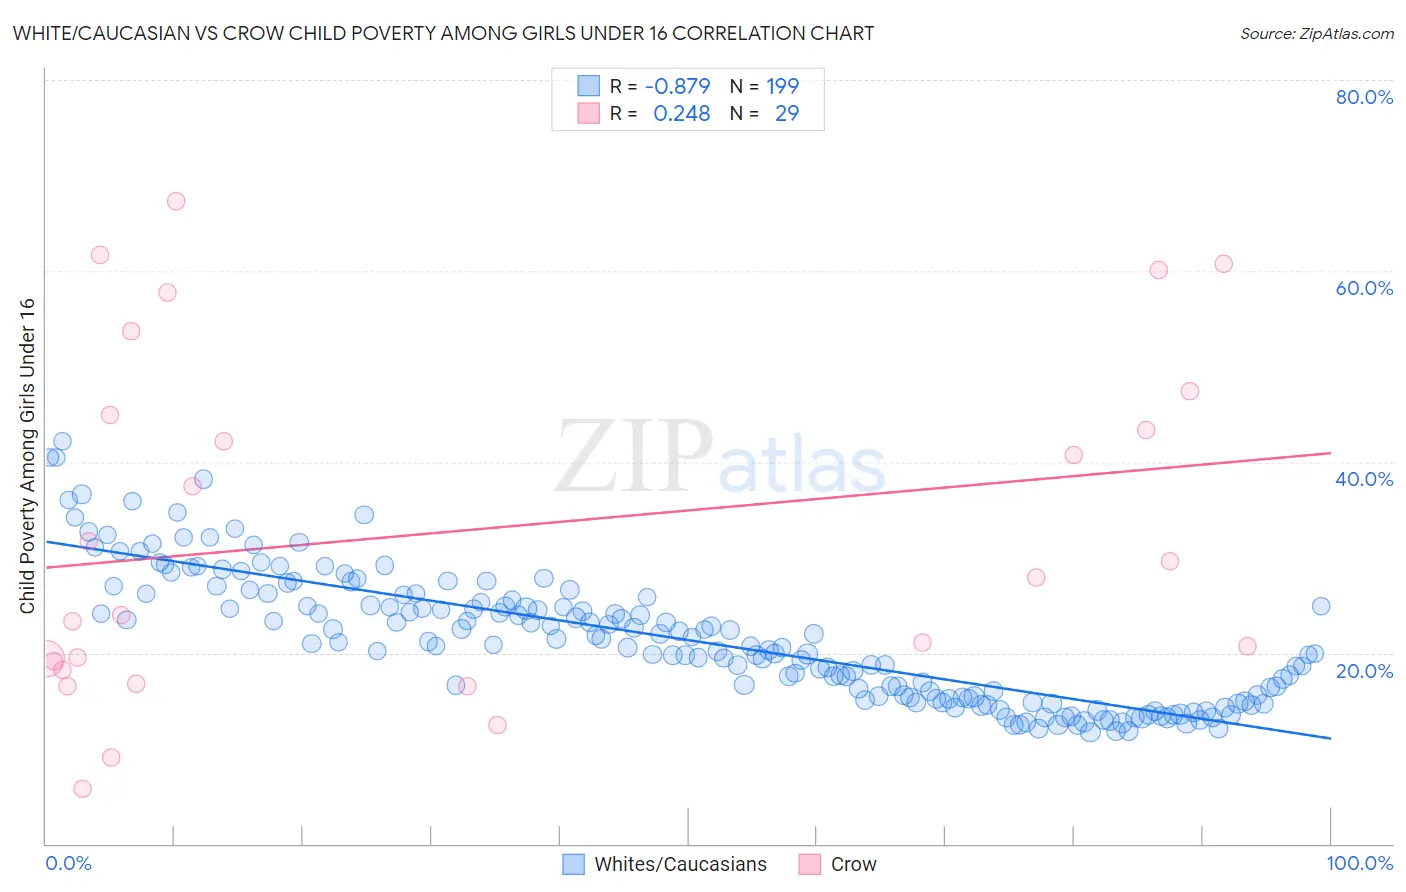
White/Caucasian vs Crow Child Poverty Among Girls Under 16 Correlation Chart
The statistical analysis conducted on geographies consisting of 558,680,954 people shows a very strong negative correlation between the proportion of Whites/Caucasians and poverty level among girls under the age of 16 in the United States with a correlation coefficient (R) of -0.879 and weighted average of 16.6%. Similarly, the statistical analysis conducted on geographies consisting of 59,004,604 people shows a weak positive correlation between the proportion of Crow and poverty level among girls under the age of 16 in the United States with a correlation coefficient (R) of 0.248 and weighted average of 26.4%, a difference of 58.9%.
Child Poverty Among Girls Under 16 Correlation Summary
| Measurement | White/Caucasian | Crow |
| Minimum | 11.7% | 5.8% |
| Maximum | 42.2% | 67.4% |
| Range | 30.5% | 61.6% |
| Mean | 21.4% | 32.7% |
| Median | 20.7% | 27.9% |
| Interquartile 25% (IQ1) | 15.2% | 18.7% |
| Interquartile 75% (IQ3) | 25.5% | 46.2% |
| Interquartile Range (IQR) | 10.3% | 27.5% |
| Standard Deviation (Sample) | 6.8% | 17.9% |
| Standard Deviation (Population) | 6.7% | 17.6% |
Similar Demographics by Child Poverty Among Girls Under 16
Demographics Similar to Whites/Caucasians by Child Poverty Among Girls Under 16
In terms of child poverty among girls under 16, the demographic groups most similar to Whites/Caucasians are Hawaiian (16.6%, a difference of 0.030%), Immigrants from Syria (16.6%, a difference of 0.040%), Immigrants from Western Asia (16.6%, a difference of 0.060%), Immigrants from Iraq (16.6%, a difference of 0.060%), and Immigrants from Ethiopia (16.6%, a difference of 0.070%).
| Demographics | Rating | Rank | Child Poverty Among Girls Under 16 |
| Immigrants | Saudi Arabia | 64.0 /100 | #171 | Good 16.2% |
| Afghans | 62.3 /100 | #172 | Good 16.2% |
| Immigrants | South America | 55.1 /100 | #173 | Average 16.4% |
| Ethiopians | 50.0 /100 | #174 | Average 16.5% |
| Lebanese | 45.4 /100 | #175 | Average 16.6% |
| Hungarians | 45.1 /100 | #176 | Average 16.6% |
| Immigrants | Western Asia | 44.1 /100 | #177 | Average 16.6% |
| Whites/Caucasians | 43.6 /100 | #178 | Average 16.6% |
| Hawaiians | 43.4 /100 | #179 | Average 16.6% |
| Immigrants | Syria | 43.3 /100 | #180 | Average 16.6% |
| Immigrants | Iraq | 43.2 /100 | #181 | Average 16.6% |
| Immigrants | Ethiopia | 43.1 /100 | #182 | Average 16.6% |
| Immigrants | Portugal | 42.5 /100 | #183 | Average 16.6% |
| Scotch-Irish | 39.6 /100 | #184 | Fair 16.7% |
| Immigrants | Uruguay | 35.6 /100 | #185 | Fair 16.7% |
Demographics Similar to Crow by Child Poverty Among Girls Under 16
In terms of child poverty among girls under 16, the demographic groups most similar to Crow are Cheyenne (26.3%, a difference of 0.34%), Yup'ik (25.8%, a difference of 2.1%), Yuman (27.1%, a difference of 2.7%), Sioux (25.6%, a difference of 3.1%), and Pueblo (25.2%, a difference of 4.6%).
| Demographics | Rating | Rank | Child Poverty Among Girls Under 16 |
| Natives/Alaskans | 0.0 /100 | #332 | Tragic 24.0% |
| Blacks/African Americans | 0.0 /100 | #333 | Tragic 24.7% |
| Menominee | 0.0 /100 | #334 | Tragic 25.0% |
| Pueblo | 0.0 /100 | #335 | Tragic 25.2% |
| Sioux | 0.0 /100 | #336 | Tragic 25.6% |
| Yup'ik | 0.0 /100 | #337 | Tragic 25.8% |
| Cheyenne | 0.0 /100 | #338 | Tragic 26.3% |
| Crow | 0.0 /100 | #339 | Tragic 26.4% |
| Yuman | 0.0 /100 | #340 | Tragic 27.1% |
| Hopi | 0.0 /100 | #341 | Tragic 27.9% |
| Pima | 0.0 /100 | #342 | Tragic 28.2% |
| Immigrants | Yemen | 0.0 /100 | #343 | Tragic 29.5% |
| Navajo | 0.0 /100 | #344 | Tragic 30.5% |
| Lumbee | 0.0 /100 | #345 | Tragic 30.7% |
| Tohono O'odham | 0.0 /100 | #346 | Tragic 31.6% |