White/Caucasian vs Immigrants from Western Africa Child Poverty Among Girls Under 16
COMPARE
White/Caucasian
Immigrants from Western Africa
Child Poverty Among Girls Under 16
Child Poverty Among Girls Under 16 Comparison
Whites/Caucasians
Immigrants from Western Africa
16.6%
CHILD POVERTY AMONG GIRLS UNDER 16
43.6/ 100
METRIC RATING
178th/ 347
METRIC RANK
19.3%
CHILD POVERTY AMONG GIRLS UNDER 16
0.3/ 100
METRIC RATING
254th/ 347
METRIC RANK
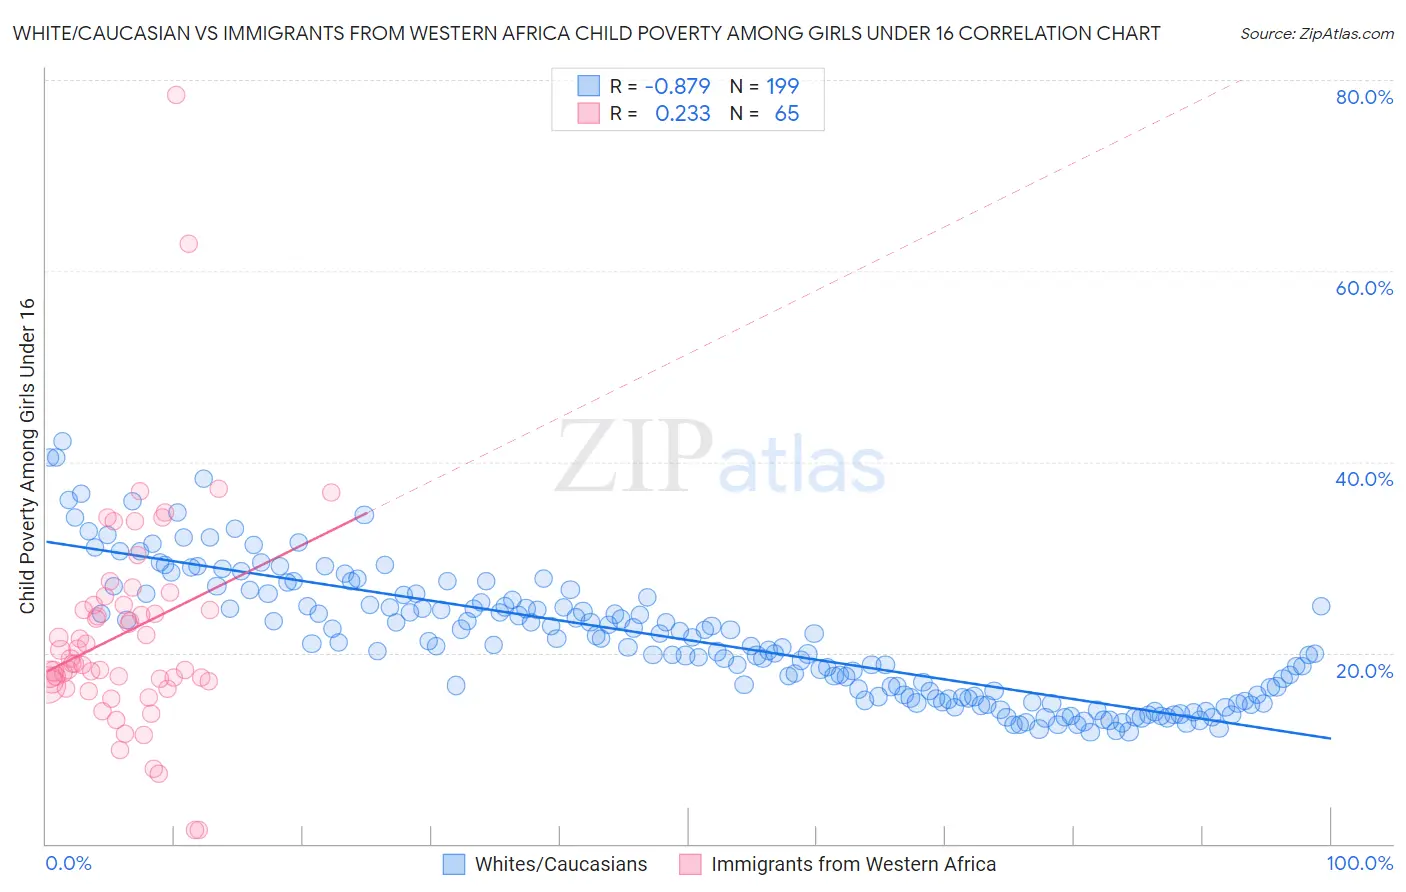
White/Caucasian vs Immigrants from Western Africa Child Poverty Among Girls Under 16 Correlation Chart
The statistical analysis conducted on geographies consisting of 558,680,954 people shows a very strong negative correlation between the proportion of Whites/Caucasians and poverty level among girls under the age of 16 in the United States with a correlation coefficient (R) of -0.879 and weighted average of 16.6%. Similarly, the statistical analysis conducted on geographies consisting of 353,292,539 people shows a weak positive correlation between the proportion of Immigrants from Western Africa and poverty level among girls under the age of 16 in the United States with a correlation coefficient (R) of 0.233 and weighted average of 19.3%, a difference of 16.3%.
Child Poverty Among Girls Under 16 Correlation Summary
| Measurement | White/Caucasian | Immigrants from Western Africa |
| Minimum | 11.7% | 1.4% |
| Maximum | 42.2% | 78.4% |
| Range | 30.5% | 77.0% |
| Mean | 21.4% | 22.1% |
| Median | 20.7% | 18.9% |
| Interquartile 25% (IQ1) | 15.2% | 16.8% |
| Interquartile 75% (IQ3) | 25.5% | 25.0% |
| Interquartile Range (IQR) | 10.3% | 8.2% |
| Standard Deviation (Sample) | 6.8% | 11.8% |
| Standard Deviation (Population) | 6.7% | 11.7% |
Similar Demographics by Child Poverty Among Girls Under 16
Demographics Similar to Whites/Caucasians by Child Poverty Among Girls Under 16
In terms of child poverty among girls under 16, the demographic groups most similar to Whites/Caucasians are Hawaiian (16.6%, a difference of 0.030%), Immigrants from Syria (16.6%, a difference of 0.040%), Immigrants from Western Asia (16.6%, a difference of 0.060%), Immigrants from Iraq (16.6%, a difference of 0.060%), and Immigrants from Ethiopia (16.6%, a difference of 0.070%).
| Demographics | Rating | Rank | Child Poverty Among Girls Under 16 |
| Immigrants | Saudi Arabia | 64.0 /100 | #171 | Good 16.2% |
| Afghans | 62.3 /100 | #172 | Good 16.2% |
| Immigrants | South America | 55.1 /100 | #173 | Average 16.4% |
| Ethiopians | 50.0 /100 | #174 | Average 16.5% |
| Lebanese | 45.4 /100 | #175 | Average 16.6% |
| Hungarians | 45.1 /100 | #176 | Average 16.6% |
| Immigrants | Western Asia | 44.1 /100 | #177 | Average 16.6% |
| Whites/Caucasians | 43.6 /100 | #178 | Average 16.6% |
| Hawaiians | 43.4 /100 | #179 | Average 16.6% |
| Immigrants | Syria | 43.3 /100 | #180 | Average 16.6% |
| Immigrants | Iraq | 43.2 /100 | #181 | Average 16.6% |
| Immigrants | Ethiopia | 43.1 /100 | #182 | Average 16.6% |
| Immigrants | Portugal | 42.5 /100 | #183 | Average 16.6% |
| Scotch-Irish | 39.6 /100 | #184 | Fair 16.7% |
| Immigrants | Uruguay | 35.6 /100 | #185 | Fair 16.7% |
Demographics Similar to Immigrants from Western Africa by Child Poverty Among Girls Under 16
In terms of child poverty among girls under 16, the demographic groups most similar to Immigrants from Western Africa are Immigrants from Ecuador (19.3%, a difference of 0.020%), Immigrants from Guyana (19.3%, a difference of 0.060%), Trinidadian and Tobagonian (19.3%, a difference of 0.080%), Immigrants from Middle Africa (19.2%, a difference of 0.26%), and Immigrants from Trinidad and Tobago (19.2%, a difference of 0.30%).
| Demographics | Rating | Rank | Child Poverty Among Girls Under 16 |
| Immigrants | Ghana | 0.5 /100 | #247 | Tragic 18.9% |
| French American Indians | 0.3 /100 | #248 | Tragic 19.2% |
| Potawatomi | 0.3 /100 | #249 | Tragic 19.2% |
| Cape Verdeans | 0.3 /100 | #250 | Tragic 19.2% |
| Immigrants | Trinidad and Tobago | 0.3 /100 | #251 | Tragic 19.2% |
| Immigrants | Middle Africa | 0.3 /100 | #252 | Tragic 19.2% |
| Immigrants | Guyana | 0.3 /100 | #253 | Tragic 19.3% |
| Immigrants | Western Africa | 0.3 /100 | #254 | Tragic 19.3% |
| Immigrants | Ecuador | 0.3 /100 | #255 | Tragic 19.3% |
| Trinidadians and Tobagonians | 0.2 /100 | #256 | Tragic 19.3% |
| Guyanese | 0.2 /100 | #257 | Tragic 19.4% |
| Salvadorans | 0.2 /100 | #258 | Tragic 19.4% |
| Ottawa | 0.2 /100 | #259 | Tragic 19.4% |
| Mexican American Indians | 0.2 /100 | #260 | Tragic 19.5% |
| Vietnamese | 0.2 /100 | #261 | Tragic 19.5% |