Celtic vs Crow Child Poverty Among Girls Under 16
COMPARE
Celtic
Crow
Child Poverty Among Girls Under 16
Child Poverty Among Girls Under 16 Comparison
Celtics
Crow
17.0%
CHILD POVERTY AMONG GIRLS UNDER 16
25.2/ 100
METRIC RATING
196th/ 347
METRIC RANK
26.4%
CHILD POVERTY AMONG GIRLS UNDER 16
0.0/ 100
METRIC RATING
339th/ 347
METRIC RANK
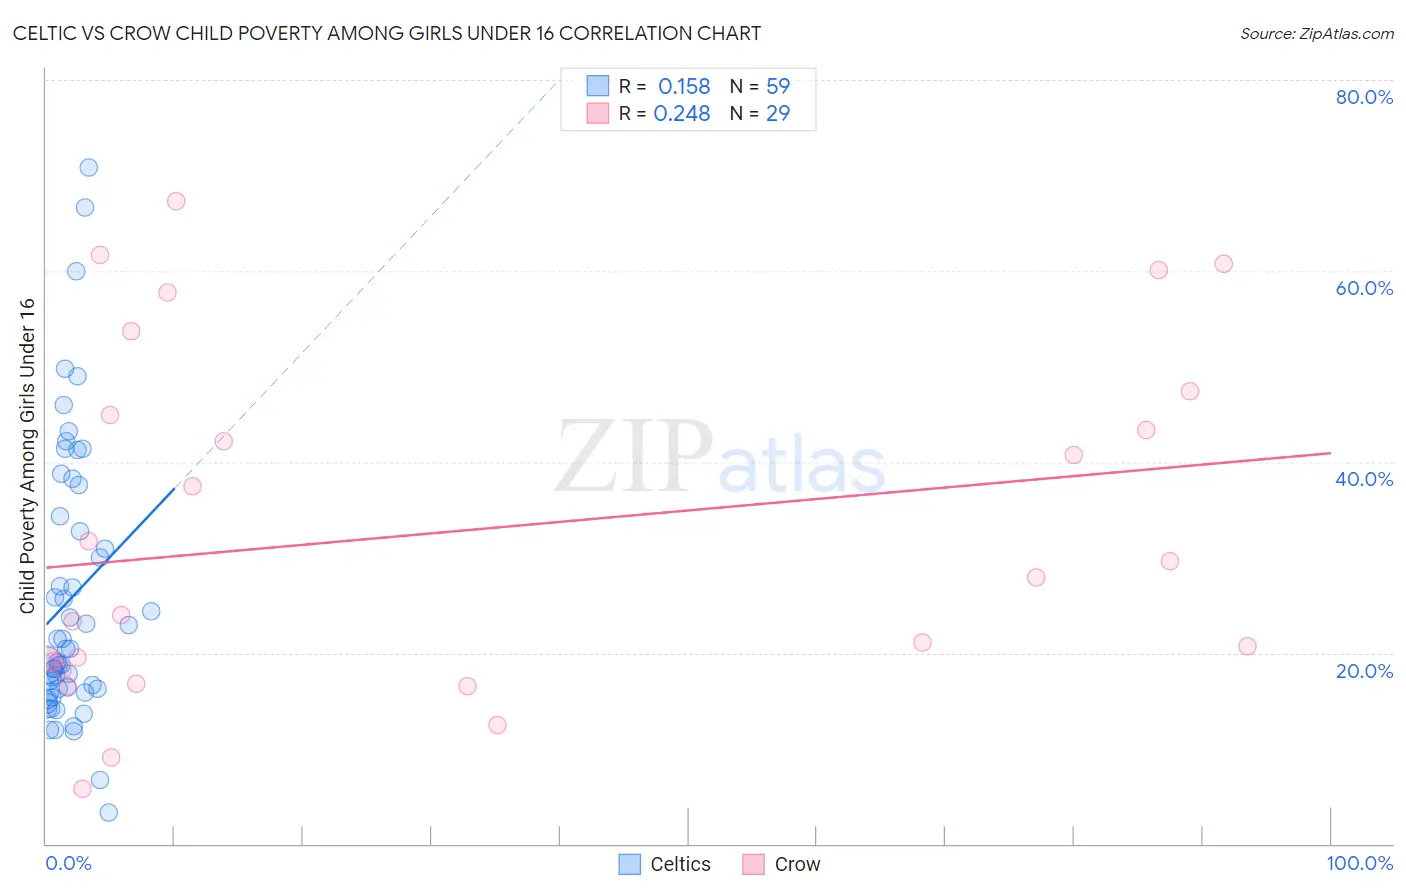
Celtic vs Crow Child Poverty Among Girls Under 16 Correlation Chart
The statistical analysis conducted on geographies consisting of 167,177,387 people shows a poor positive correlation between the proportion of Celtics and poverty level among girls under the age of 16 in the United States with a correlation coefficient (R) of 0.158 and weighted average of 17.0%. Similarly, the statistical analysis conducted on geographies consisting of 59,004,604 people shows a weak positive correlation between the proportion of Crow and poverty level among girls under the age of 16 in the United States with a correlation coefficient (R) of 0.248 and weighted average of 26.4%, a difference of 55.2%.
Child Poverty Among Girls Under 16 Correlation Summary
| Measurement | Celtic | Crow |
| Minimum | 3.3% | 5.8% |
| Maximum | 70.9% | 67.4% |
| Range | 67.6% | 61.6% |
| Mean | 25.7% | 32.7% |
| Median | 20.4% | 27.9% |
| Interquartile 25% (IQ1) | 15.9% | 18.7% |
| Interquartile 75% (IQ3) | 34.3% | 46.2% |
| Interquartile Range (IQR) | 18.4% | 27.5% |
| Standard Deviation (Sample) | 14.5% | 17.9% |
| Standard Deviation (Population) | 14.3% | 17.6% |
Similar Demographics by Child Poverty Among Girls Under 16
Demographics Similar to Celtics by Child Poverty Among Girls Under 16
In terms of child poverty among girls under 16, the demographic groups most similar to Celtics are Immigrants from Costa Rica (17.0%, a difference of 0.050%), Spaniard (17.0%, a difference of 0.050%), Immigrants from Lebanon (17.1%, a difference of 0.41%), Immigrants from Afghanistan (17.1%, a difference of 0.43%), and Spanish (16.9%, a difference of 0.48%).
| Demographics | Rating | Rank | Child Poverty Among Girls Under 16 |
| Immigrants | Bosnia and Herzegovina | 32.5 /100 | #189 | Fair 16.8% |
| Kenyans | 32.3 /100 | #190 | Fair 16.8% |
| Immigrants | Azores | 31.3 /100 | #191 | Fair 16.8% |
| Immigrants | Uganda | 31.3 /100 | #192 | Fair 16.8% |
| Aleuts | 28.7 /100 | #193 | Fair 16.9% |
| Spanish | 28.6 /100 | #194 | Fair 16.9% |
| Immigrants | Costa Rica | 25.6 /100 | #195 | Fair 17.0% |
| Celtics | 25.2 /100 | #196 | Fair 17.0% |
| Spaniards | 24.9 /100 | #197 | Fair 17.0% |
| Immigrants | Lebanon | 22.6 /100 | #198 | Fair 17.1% |
| Immigrants | Afghanistan | 22.4 /100 | #199 | Fair 17.1% |
| Immigrants | Uzbekistan | 21.5 /100 | #200 | Fair 17.1% |
| Immigrants | Kenya | 17.8 /100 | #201 | Poor 17.2% |
| Immigrants | Sierra Leone | 17.6 /100 | #202 | Poor 17.2% |
| Ugandans | 17.5 /100 | #203 | Poor 17.2% |
Demographics Similar to Crow by Child Poverty Among Girls Under 16
In terms of child poverty among girls under 16, the demographic groups most similar to Crow are Cheyenne (26.3%, a difference of 0.34%), Yup'ik (25.8%, a difference of 2.1%), Yuman (27.1%, a difference of 2.7%), Sioux (25.6%, a difference of 3.1%), and Pueblo (25.2%, a difference of 4.6%).
| Demographics | Rating | Rank | Child Poverty Among Girls Under 16 |
| Natives/Alaskans | 0.0 /100 | #332 | Tragic 24.0% |
| Blacks/African Americans | 0.0 /100 | #333 | Tragic 24.7% |
| Menominee | 0.0 /100 | #334 | Tragic 25.0% |
| Pueblo | 0.0 /100 | #335 | Tragic 25.2% |
| Sioux | 0.0 /100 | #336 | Tragic 25.6% |
| Yup'ik | 0.0 /100 | #337 | Tragic 25.8% |
| Cheyenne | 0.0 /100 | #338 | Tragic 26.3% |
| Crow | 0.0 /100 | #339 | Tragic 26.4% |
| Yuman | 0.0 /100 | #340 | Tragic 27.1% |
| Hopi | 0.0 /100 | #341 | Tragic 27.9% |
| Pima | 0.0 /100 | #342 | Tragic 28.2% |
| Immigrants | Yemen | 0.0 /100 | #343 | Tragic 29.5% |
| Navajo | 0.0 /100 | #344 | Tragic 30.5% |
| Lumbee | 0.0 /100 | #345 | Tragic 30.7% |
| Tohono O'odham | 0.0 /100 | #346 | Tragic 31.6% |