White/Caucasian vs Seminole Child Poverty Among Girls Under 16
COMPARE
White/Caucasian
Seminole
Child Poverty Among Girls Under 16
Child Poverty Among Girls Under 16 Comparison
Whites/Caucasians
Seminole
16.6%
CHILD POVERTY AMONG GIRLS UNDER 16
43.6/ 100
METRIC RATING
178th/ 347
METRIC RANK
21.2%
CHILD POVERTY AMONG GIRLS UNDER 16
0.0/ 100
METRIC RATING
302nd/ 347
METRIC RANK
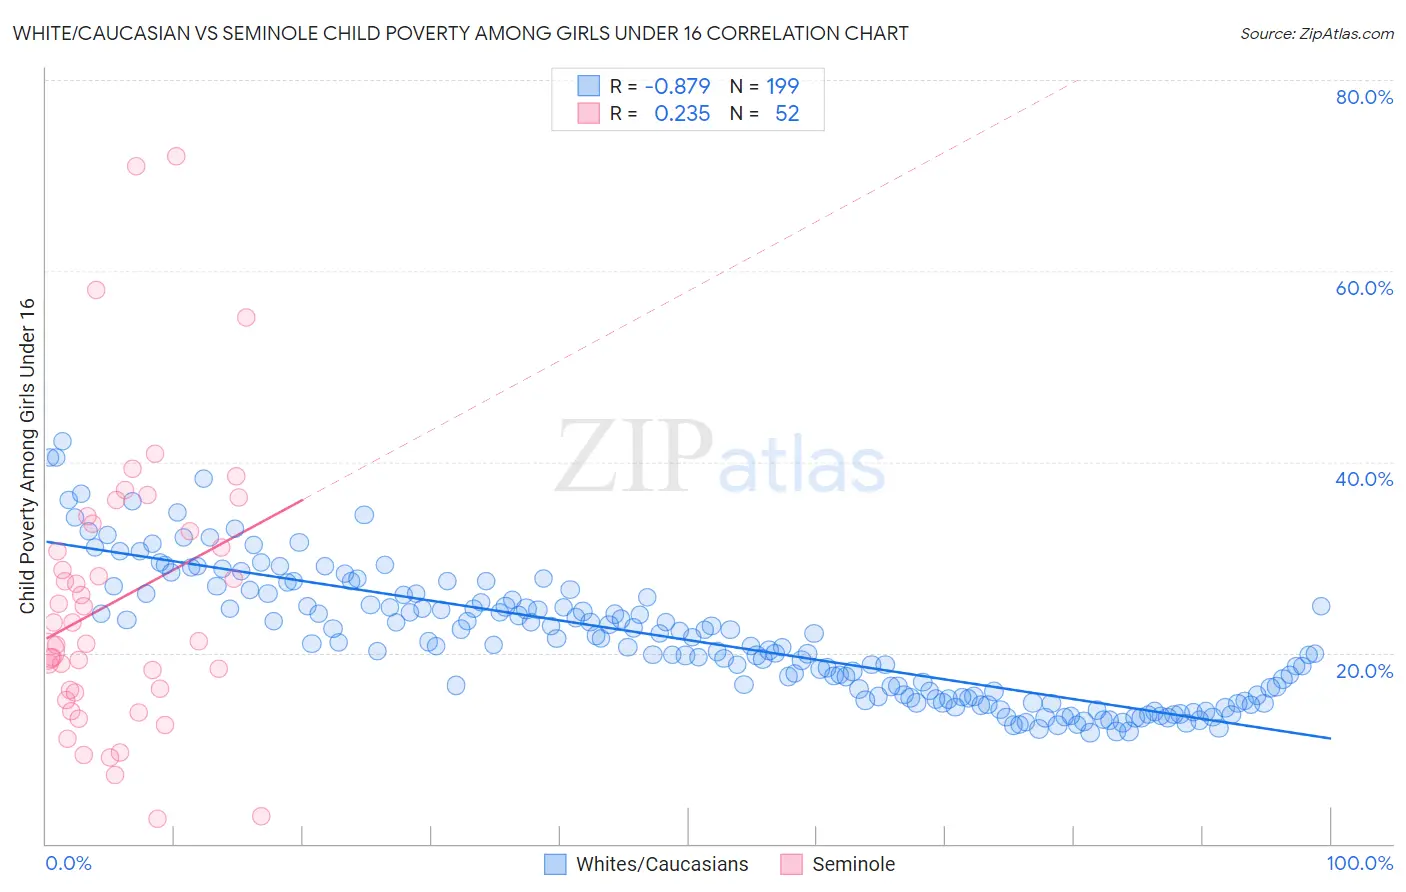
White/Caucasian vs Seminole Child Poverty Among Girls Under 16 Correlation Chart
The statistical analysis conducted on geographies consisting of 558,680,954 people shows a very strong negative correlation between the proportion of Whites/Caucasians and poverty level among girls under the age of 16 in the United States with a correlation coefficient (R) of -0.879 and weighted average of 16.6%. Similarly, the statistical analysis conducted on geographies consisting of 117,946,646 people shows a weak positive correlation between the proportion of Seminole and poverty level among girls under the age of 16 in the United States with a correlation coefficient (R) of 0.235 and weighted average of 21.2%, a difference of 27.6%.
Child Poverty Among Girls Under 16 Correlation Summary
| Measurement | White/Caucasian | Seminole |
| Minimum | 11.7% | 2.6% |
| Maximum | 42.2% | 72.0% |
| Range | 30.5% | 69.4% |
| Mean | 21.4% | 25.5% |
| Median | 20.7% | 22.2% |
| Interquartile 25% (IQ1) | 15.2% | 16.0% |
| Interquartile 75% (IQ3) | 25.5% | 33.1% |
| Interquartile Range (IQR) | 10.3% | 17.2% |
| Standard Deviation (Sample) | 6.8% | 14.9% |
| Standard Deviation (Population) | 6.7% | 14.7% |
Similar Demographics by Child Poverty Among Girls Under 16
Demographics Similar to Whites/Caucasians by Child Poverty Among Girls Under 16
In terms of child poverty among girls under 16, the demographic groups most similar to Whites/Caucasians are Hawaiian (16.6%, a difference of 0.030%), Immigrants from Syria (16.6%, a difference of 0.040%), Immigrants from Western Asia (16.6%, a difference of 0.060%), Immigrants from Iraq (16.6%, a difference of 0.060%), and Immigrants from Ethiopia (16.6%, a difference of 0.070%).
| Demographics | Rating | Rank | Child Poverty Among Girls Under 16 |
| Immigrants | Saudi Arabia | 64.0 /100 | #171 | Good 16.2% |
| Afghans | 62.3 /100 | #172 | Good 16.2% |
| Immigrants | South America | 55.1 /100 | #173 | Average 16.4% |
| Ethiopians | 50.0 /100 | #174 | Average 16.5% |
| Lebanese | 45.4 /100 | #175 | Average 16.6% |
| Hungarians | 45.1 /100 | #176 | Average 16.6% |
| Immigrants | Western Asia | 44.1 /100 | #177 | Average 16.6% |
| Whites/Caucasians | 43.6 /100 | #178 | Average 16.6% |
| Hawaiians | 43.4 /100 | #179 | Average 16.6% |
| Immigrants | Syria | 43.3 /100 | #180 | Average 16.6% |
| Immigrants | Iraq | 43.2 /100 | #181 | Average 16.6% |
| Immigrants | Ethiopia | 43.1 /100 | #182 | Average 16.6% |
| Immigrants | Portugal | 42.5 /100 | #183 | Average 16.6% |
| Scotch-Irish | 39.6 /100 | #184 | Fair 16.7% |
| Immigrants | Uruguay | 35.6 /100 | #185 | Fair 16.7% |
Demographics Similar to Seminole by Child Poverty Among Girls Under 16
In terms of child poverty among girls under 16, the demographic groups most similar to Seminole are Choctaw (21.1%, a difference of 0.12%), British West Indian (21.3%, a difference of 0.45%), Indonesian (21.3%, a difference of 0.48%), Somali (21.0%, a difference of 0.73%), and Hispanic or Latino (21.0%, a difference of 1.1%).
| Demographics | Rating | Rank | Child Poverty Among Girls Under 16 |
| Immigrants | Caribbean | 0.0 /100 | #295 | Tragic 20.7% |
| Immigrants | West Indies | 0.0 /100 | #296 | Tragic 20.7% |
| Inupiat | 0.0 /100 | #297 | Tragic 20.8% |
| Mexicans | 0.0 /100 | #298 | Tragic 20.9% |
| Hispanics or Latinos | 0.0 /100 | #299 | Tragic 21.0% |
| Somalis | 0.0 /100 | #300 | Tragic 21.0% |
| Choctaw | 0.0 /100 | #301 | Tragic 21.1% |
| Seminole | 0.0 /100 | #302 | Tragic 21.2% |
| British West Indians | 0.0 /100 | #303 | Tragic 21.3% |
| Indonesians | 0.0 /100 | #304 | Tragic 21.3% |
| Guatemalans | 0.0 /100 | #305 | Tragic 21.4% |
| Immigrants | Central America | 0.0 /100 | #306 | Tragic 21.4% |
| Immigrants | Bahamas | 0.0 /100 | #307 | Tragic 21.4% |
| Houma | 0.0 /100 | #308 | Tragic 21.5% |
| Bahamians | 0.0 /100 | #309 | Tragic 21.5% |