White/Caucasian vs Burmese Child Poverty Among Girls Under 16
COMPARE
White/Caucasian
Burmese
Child Poverty Among Girls Under 16
Child Poverty Among Girls Under 16 Comparison
Whites/Caucasians
Burmese
16.6%
CHILD POVERTY AMONG GIRLS UNDER 16
43.6/ 100
METRIC RATING
178th/ 347
METRIC RANK
13.0%
CHILD POVERTY AMONG GIRLS UNDER 16
99.9/ 100
METRIC RATING
14th/ 347
METRIC RANK
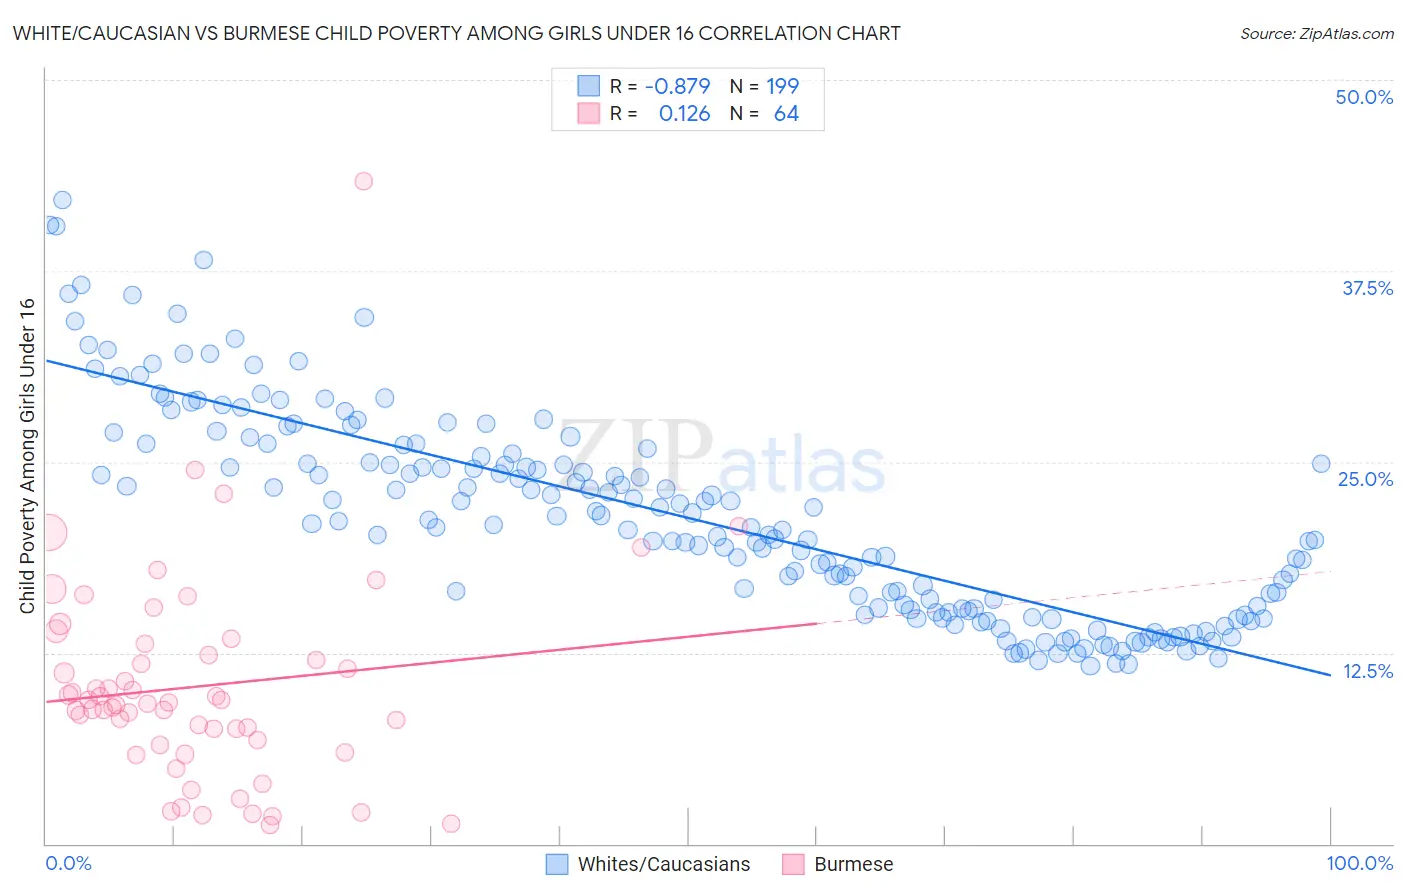
White/Caucasian vs Burmese Child Poverty Among Girls Under 16 Correlation Chart
The statistical analysis conducted on geographies consisting of 558,680,954 people shows a very strong negative correlation between the proportion of Whites/Caucasians and poverty level among girls under the age of 16 in the United States with a correlation coefficient (R) of -0.879 and weighted average of 16.6%. Similarly, the statistical analysis conducted on geographies consisting of 454,212,415 people shows a poor positive correlation between the proportion of Burmese and poverty level among girls under the age of 16 in the United States with a correlation coefficient (R) of 0.126 and weighted average of 13.0%, a difference of 27.5%.
Child Poverty Among Girls Under 16 Correlation Summary
| Measurement | White/Caucasian | Burmese |
| Minimum | 11.7% | 1.2% |
| Maximum | 42.2% | 43.4% |
| Range | 30.5% | 42.2% |
| Mean | 21.4% | 10.3% |
| Median | 20.7% | 9.2% |
| Interquartile 25% (IQ1) | 15.2% | 6.6% |
| Interquartile 75% (IQ3) | 25.5% | 12.7% |
| Interquartile Range (IQR) | 10.3% | 6.1% |
| Standard Deviation (Sample) | 6.8% | 6.8% |
| Standard Deviation (Population) | 6.7% | 6.8% |
Similar Demographics by Child Poverty Among Girls Under 16
Demographics Similar to Whites/Caucasians by Child Poverty Among Girls Under 16
In terms of child poverty among girls under 16, the demographic groups most similar to Whites/Caucasians are Hawaiian (16.6%, a difference of 0.030%), Immigrants from Syria (16.6%, a difference of 0.040%), Immigrants from Western Asia (16.6%, a difference of 0.060%), Immigrants from Iraq (16.6%, a difference of 0.060%), and Immigrants from Ethiopia (16.6%, a difference of 0.070%).
| Demographics | Rating | Rank | Child Poverty Among Girls Under 16 |
| Immigrants | Saudi Arabia | 64.0 /100 | #171 | Good 16.2% |
| Afghans | 62.3 /100 | #172 | Good 16.2% |
| Immigrants | South America | 55.1 /100 | #173 | Average 16.4% |
| Ethiopians | 50.0 /100 | #174 | Average 16.5% |
| Lebanese | 45.4 /100 | #175 | Average 16.6% |
| Hungarians | 45.1 /100 | #176 | Average 16.6% |
| Immigrants | Western Asia | 44.1 /100 | #177 | Average 16.6% |
| Whites/Caucasians | 43.6 /100 | #178 | Average 16.6% |
| Hawaiians | 43.4 /100 | #179 | Average 16.6% |
| Immigrants | Syria | 43.3 /100 | #180 | Average 16.6% |
| Immigrants | Iraq | 43.2 /100 | #181 | Average 16.6% |
| Immigrants | Ethiopia | 43.1 /100 | #182 | Average 16.6% |
| Immigrants | Portugal | 42.5 /100 | #183 | Average 16.6% |
| Scotch-Irish | 39.6 /100 | #184 | Fair 16.7% |
| Immigrants | Uruguay | 35.6 /100 | #185 | Fair 16.7% |
Demographics Similar to Burmese by Child Poverty Among Girls Under 16
In terms of child poverty among girls under 16, the demographic groups most similar to Burmese are Okinawan (13.0%, a difference of 0.010%), Immigrants from Lithuania (13.1%, a difference of 0.93%), Bulgarian (13.1%, a difference of 1.0%), Immigrants from Korea (13.1%, a difference of 1.0%), and Immigrants from Ireland (12.9%, a difference of 1.1%).
| Demographics | Rating | Rank | Child Poverty Among Girls Under 16 |
| Chinese | 100.0 /100 | #7 | Exceptional 12.3% |
| Iranians | 100.0 /100 | #8 | Exceptional 12.4% |
| Immigrants | Singapore | 100.0 /100 | #9 | Exceptional 12.5% |
| Immigrants | Iran | 100.0 /100 | #10 | Exceptional 12.6% |
| Immigrants | South Central Asia | 100.0 /100 | #11 | Exceptional 12.7% |
| Bhutanese | 100.0 /100 | #12 | Exceptional 12.7% |
| Immigrants | Ireland | 99.9 /100 | #13 | Exceptional 12.9% |
| Burmese | 99.9 /100 | #14 | Exceptional 13.0% |
| Okinawans | 99.9 /100 | #15 | Exceptional 13.0% |
| Immigrants | Lithuania | 99.9 /100 | #16 | Exceptional 13.1% |
| Bulgarians | 99.9 /100 | #17 | Exceptional 13.1% |
| Immigrants | Korea | 99.9 /100 | #18 | Exceptional 13.1% |
| Cypriots | 99.9 /100 | #19 | Exceptional 13.2% |
| Immigrants | Japan | 99.9 /100 | #20 | Exceptional 13.3% |
| Assyrians/Chaldeans/Syriacs | 99.9 /100 | #21 | Exceptional 13.3% |