White/Caucasian vs Haitian Child Poverty Among Girls Under 16
COMPARE
White/Caucasian
Haitian
Child Poverty Among Girls Under 16
Child Poverty Among Girls Under 16 Comparison
Whites/Caucasians
Haitians
16.6%
CHILD POVERTY AMONG GIRLS UNDER 16
43.6/ 100
METRIC RATING
178th/ 347
METRIC RANK
20.5%
CHILD POVERTY AMONG GIRLS UNDER 16
0.0/ 100
METRIC RATING
288th/ 347
METRIC RANK
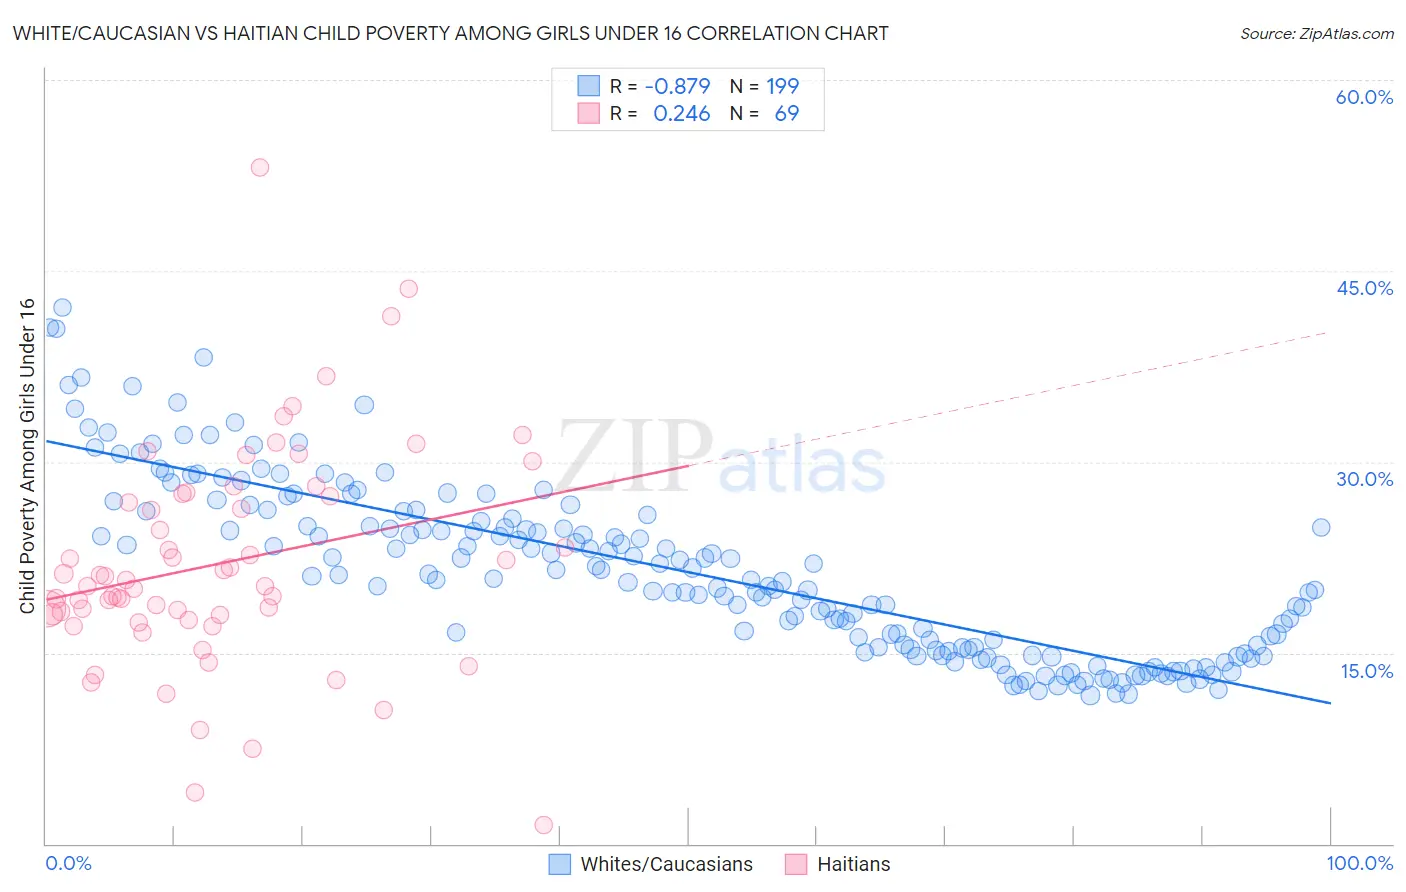
White/Caucasian vs Haitian Child Poverty Among Girls Under 16 Correlation Chart
The statistical analysis conducted on geographies consisting of 558,680,954 people shows a very strong negative correlation between the proportion of Whites/Caucasians and poverty level among girls under the age of 16 in the United States with a correlation coefficient (R) of -0.879 and weighted average of 16.6%. Similarly, the statistical analysis conducted on geographies consisting of 284,231,337 people shows a weak positive correlation between the proportion of Haitians and poverty level among girls under the age of 16 in the United States with a correlation coefficient (R) of 0.246 and weighted average of 20.5%, a difference of 23.6%.
Child Poverty Among Girls Under 16 Correlation Summary
| Measurement | White/Caucasian | Haitian |
| Minimum | 11.7% | 1.5% |
| Maximum | 42.2% | 53.2% |
| Range | 30.5% | 51.7% |
| Mean | 21.4% | 22.0% |
| Median | 20.7% | 20.2% |
| Interquartile 25% (IQ1) | 15.2% | 17.8% |
| Interquartile 75% (IQ3) | 25.5% | 27.4% |
| Interquartile Range (IQR) | 10.3% | 9.6% |
| Standard Deviation (Sample) | 6.8% | 8.7% |
| Standard Deviation (Population) | 6.7% | 8.7% |
Similar Demographics by Child Poverty Among Girls Under 16
Demographics Similar to Whites/Caucasians by Child Poverty Among Girls Under 16
In terms of child poverty among girls under 16, the demographic groups most similar to Whites/Caucasians are Hawaiian (16.6%, a difference of 0.030%), Immigrants from Syria (16.6%, a difference of 0.040%), Immigrants from Western Asia (16.6%, a difference of 0.060%), Immigrants from Iraq (16.6%, a difference of 0.060%), and Immigrants from Ethiopia (16.6%, a difference of 0.070%).
| Demographics | Rating | Rank | Child Poverty Among Girls Under 16 |
| Immigrants | Saudi Arabia | 64.0 /100 | #171 | Good 16.2% |
| Afghans | 62.3 /100 | #172 | Good 16.2% |
| Immigrants | South America | 55.1 /100 | #173 | Average 16.4% |
| Ethiopians | 50.0 /100 | #174 | Average 16.5% |
| Lebanese | 45.4 /100 | #175 | Average 16.6% |
| Hungarians | 45.1 /100 | #176 | Average 16.6% |
| Immigrants | Western Asia | 44.1 /100 | #177 | Average 16.6% |
| Whites/Caucasians | 43.6 /100 | #178 | Average 16.6% |
| Hawaiians | 43.4 /100 | #179 | Average 16.6% |
| Immigrants | Syria | 43.3 /100 | #180 | Average 16.6% |
| Immigrants | Iraq | 43.2 /100 | #181 | Average 16.6% |
| Immigrants | Ethiopia | 43.1 /100 | #182 | Average 16.6% |
| Immigrants | Portugal | 42.5 /100 | #183 | Average 16.6% |
| Scotch-Irish | 39.6 /100 | #184 | Fair 16.7% |
| Immigrants | Uruguay | 35.6 /100 | #185 | Fair 16.7% |
Demographics Similar to Haitians by Child Poverty Among Girls Under 16
In terms of child poverty among girls under 16, the demographic groups most similar to Haitians are Blackfeet (20.5%, a difference of 0.20%), Iroquois (20.4%, a difference of 0.34%), Immigrants from Belize (20.6%, a difference of 0.46%), Immigrants from Haiti (20.6%, a difference of 0.53%), and Chippewa (20.6%, a difference of 0.67%).
| Demographics | Rating | Rank | Child Poverty Among Girls Under 16 |
| Central Americans | 0.0 /100 | #281 | Tragic 20.2% |
| West Indians | 0.0 /100 | #282 | Tragic 20.3% |
| Senegalese | 0.0 /100 | #283 | Tragic 20.3% |
| Yaqui | 0.0 /100 | #284 | Tragic 20.3% |
| Immigrants | Cabo Verde | 0.0 /100 | #285 | Tragic 20.3% |
| Iroquois | 0.0 /100 | #286 | Tragic 20.4% |
| Blackfeet | 0.0 /100 | #287 | Tragic 20.5% |
| Haitians | 0.0 /100 | #288 | Tragic 20.5% |
| Immigrants | Belize | 0.0 /100 | #289 | Tragic 20.6% |
| Immigrants | Haiti | 0.0 /100 | #290 | Tragic 20.6% |
| Chippewa | 0.0 /100 | #291 | Tragic 20.6% |
| Immigrants | Latin America | 0.0 /100 | #292 | Tragic 20.6% |
| Immigrants | Grenada | 0.0 /100 | #293 | Tragic 20.7% |
| Immigrants | Senegal | 0.0 /100 | #294 | Tragic 20.7% |
| Immigrants | Caribbean | 0.0 /100 | #295 | Tragic 20.7% |