White/Caucasian vs Crow Householder Income Over 65 years
COMPARE
White/Caucasian
Crow
Householder Income Over 65 years
Householder Income Over 65 years Comparison
Whites/Caucasians
Crow
$58,847
HOUSEHOLDER INCOME OVER 65 YEARS
9.8/ 100
METRIC RATING
213th/ 347
METRIC RANK
$49,234
HOUSEHOLDER INCOME OVER 65 YEARS
0.0/ 100
METRIC RATING
335th/ 347
METRIC RANK
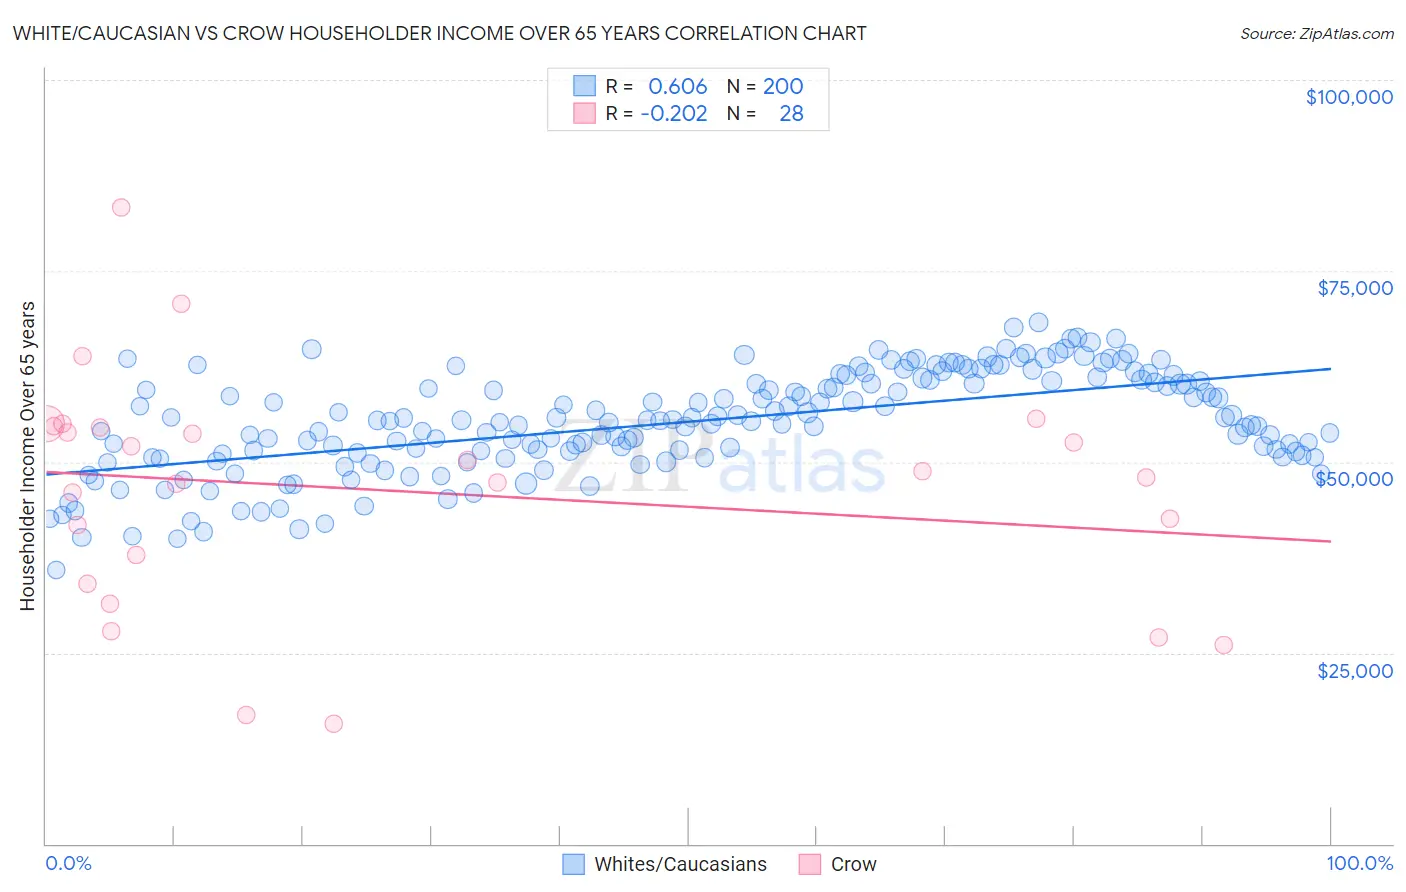
White/Caucasian vs Crow Householder Income Over 65 years Correlation Chart
The statistical analysis conducted on geographies consisting of 577,509,844 people shows a significant positive correlation between the proportion of Whites/Caucasians and household income with householder over the age of 65 in the United States with a correlation coefficient (R) of 0.606 and weighted average of $58,847. Similarly, the statistical analysis conducted on geographies consisting of 59,087,970 people shows a weak negative correlation between the proportion of Crow and household income with householder over the age of 65 in the United States with a correlation coefficient (R) of -0.202 and weighted average of $49,234, a difference of 19.5%.
Householder Income Over 65 years Correlation Summary
| Measurement | White/Caucasian | Crow |
| Minimum | $35,837 | $15,714 |
| Maximum | $68,217 | $83,321 |
| Range | $32,380 | $67,607 |
| Mean | $55,258 | $46,192 |
| Median | $55,418 | $48,334 |
| Interquartile 25% (IQ1) | $51,091 | $35,989 |
| Interquartile 75% (IQ3) | $60,670 | $54,581 |
| Interquartile Range (IQR) | $9,580 | $18,592 |
| Standard Deviation (Sample) | $6,600 | $15,233 |
| Standard Deviation (Population) | $6,583 | $14,959 |
Similar Demographics by Householder Income Over 65 years
Demographics Similar to Whites/Caucasians by Householder Income Over 65 years
In terms of householder income over 65 years, the demographic groups most similar to Whites/Caucasians are Colombian ($58,851, a difference of 0.010%), Nepalese ($58,761, a difference of 0.15%), Immigrants from Nigeria ($58,942, a difference of 0.16%), Nigerian ($58,992, a difference of 0.25%), and Slovak ($59,039, a difference of 0.33%).
| Demographics | Rating | Rank | Householder Income Over 65 years |
| Immigrants | South America | 13.0 /100 | #206 | Poor $59,151 |
| Salvadorans | 12.9 /100 | #207 | Poor $59,141 |
| Uruguayans | 12.3 /100 | #208 | Poor $59,090 |
| Slovaks | 11.7 /100 | #209 | Poor $59,039 |
| Nigerians | 11.2 /100 | #210 | Poor $58,992 |
| Immigrants | Nigeria | 10.7 /100 | #211 | Poor $58,942 |
| Colombians | 9.8 /100 | #212 | Tragic $58,851 |
| Whites/Caucasians | 9.8 /100 | #213 | Tragic $58,847 |
| Nepalese | 9.0 /100 | #214 | Tragic $58,761 |
| Immigrants | Ghana | 7.9 /100 | #215 | Tragic $58,624 |
| Immigrants | Middle Africa | 6.2 /100 | #216 | Tragic $58,375 |
| Sudanese | 5.7 /100 | #217 | Tragic $58,281 |
| Panamanians | 5.6 /100 | #218 | Tragic $58,266 |
| Malaysians | 5.5 /100 | #219 | Tragic $58,244 |
| Yugoslavians | 5.5 /100 | #220 | Tragic $58,243 |
Demographics Similar to Crow by Householder Income Over 65 years
In terms of householder income over 65 years, the demographic groups most similar to Crow are Cuban ($49,152, a difference of 0.17%), Tohono O'odham ($49,121, a difference of 0.23%), Immigrants from Caribbean ($48,535, a difference of 1.4%), Immigrants from Dominica ($50,071, a difference of 1.7%), and Cape Verdean ($50,077, a difference of 1.7%).
| Demographics | Rating | Rank | Householder Income Over 65 years |
| Hopi | 0.0 /100 | #328 | Tragic $50,925 |
| Blacks/African Americans | 0.0 /100 | #329 | Tragic $50,779 |
| Immigrants | Grenada | 0.0 /100 | #330 | Tragic $50,747 |
| Pima | 0.0 /100 | #331 | Tragic $50,539 |
| Dutch West Indians | 0.0 /100 | #332 | Tragic $50,475 |
| Cape Verdeans | 0.0 /100 | #333 | Tragic $50,077 |
| Immigrants | Dominica | 0.0 /100 | #334 | Tragic $50,071 |
| Crow | 0.0 /100 | #335 | Tragic $49,234 |
| Cubans | 0.0 /100 | #336 | Tragic $49,152 |
| Tohono O'odham | 0.0 /100 | #337 | Tragic $49,121 |
| Immigrants | Caribbean | 0.0 /100 | #338 | Tragic $48,535 |
| Navajo | 0.0 /100 | #339 | Tragic $47,722 |
| Immigrants | Yemen | 0.0 /100 | #340 | Tragic $47,527 |
| Dominicans | 0.0 /100 | #341 | Tragic $46,964 |
| Immigrants | Cabo Verde | 0.0 /100 | #342 | Tragic $46,654 |